Image 1 of 1: ‘Figure 2. Launching an App’
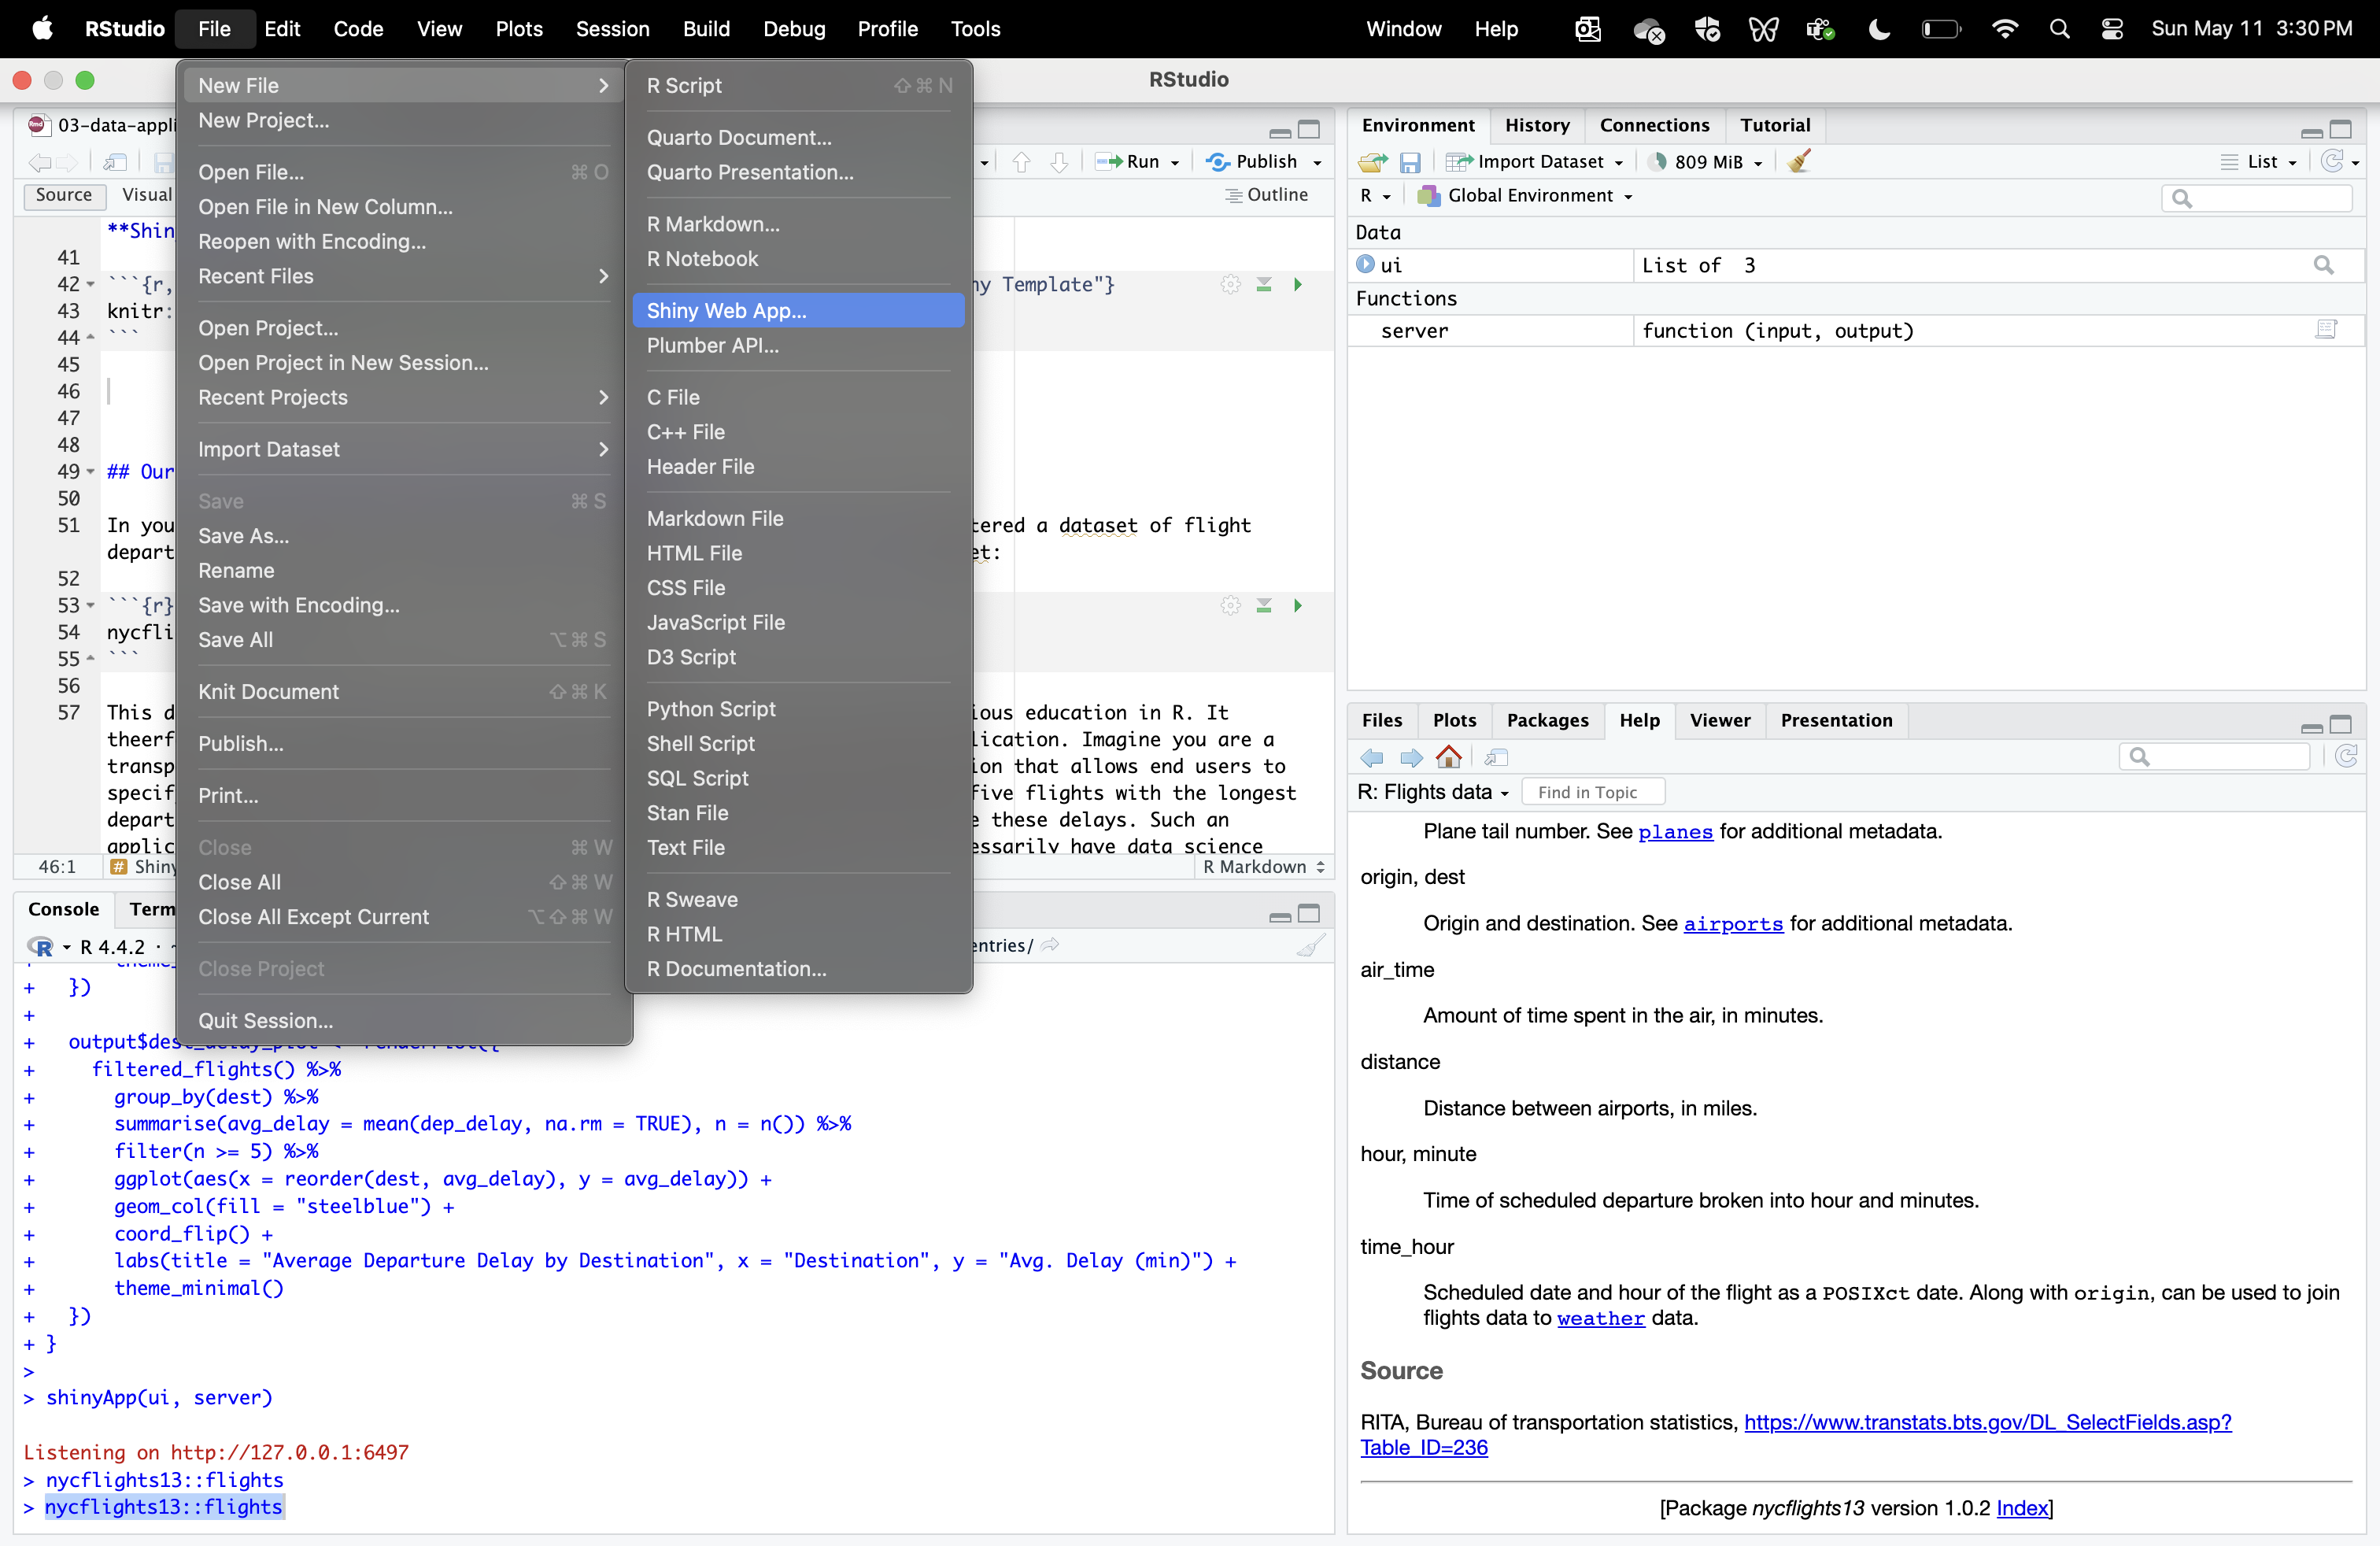
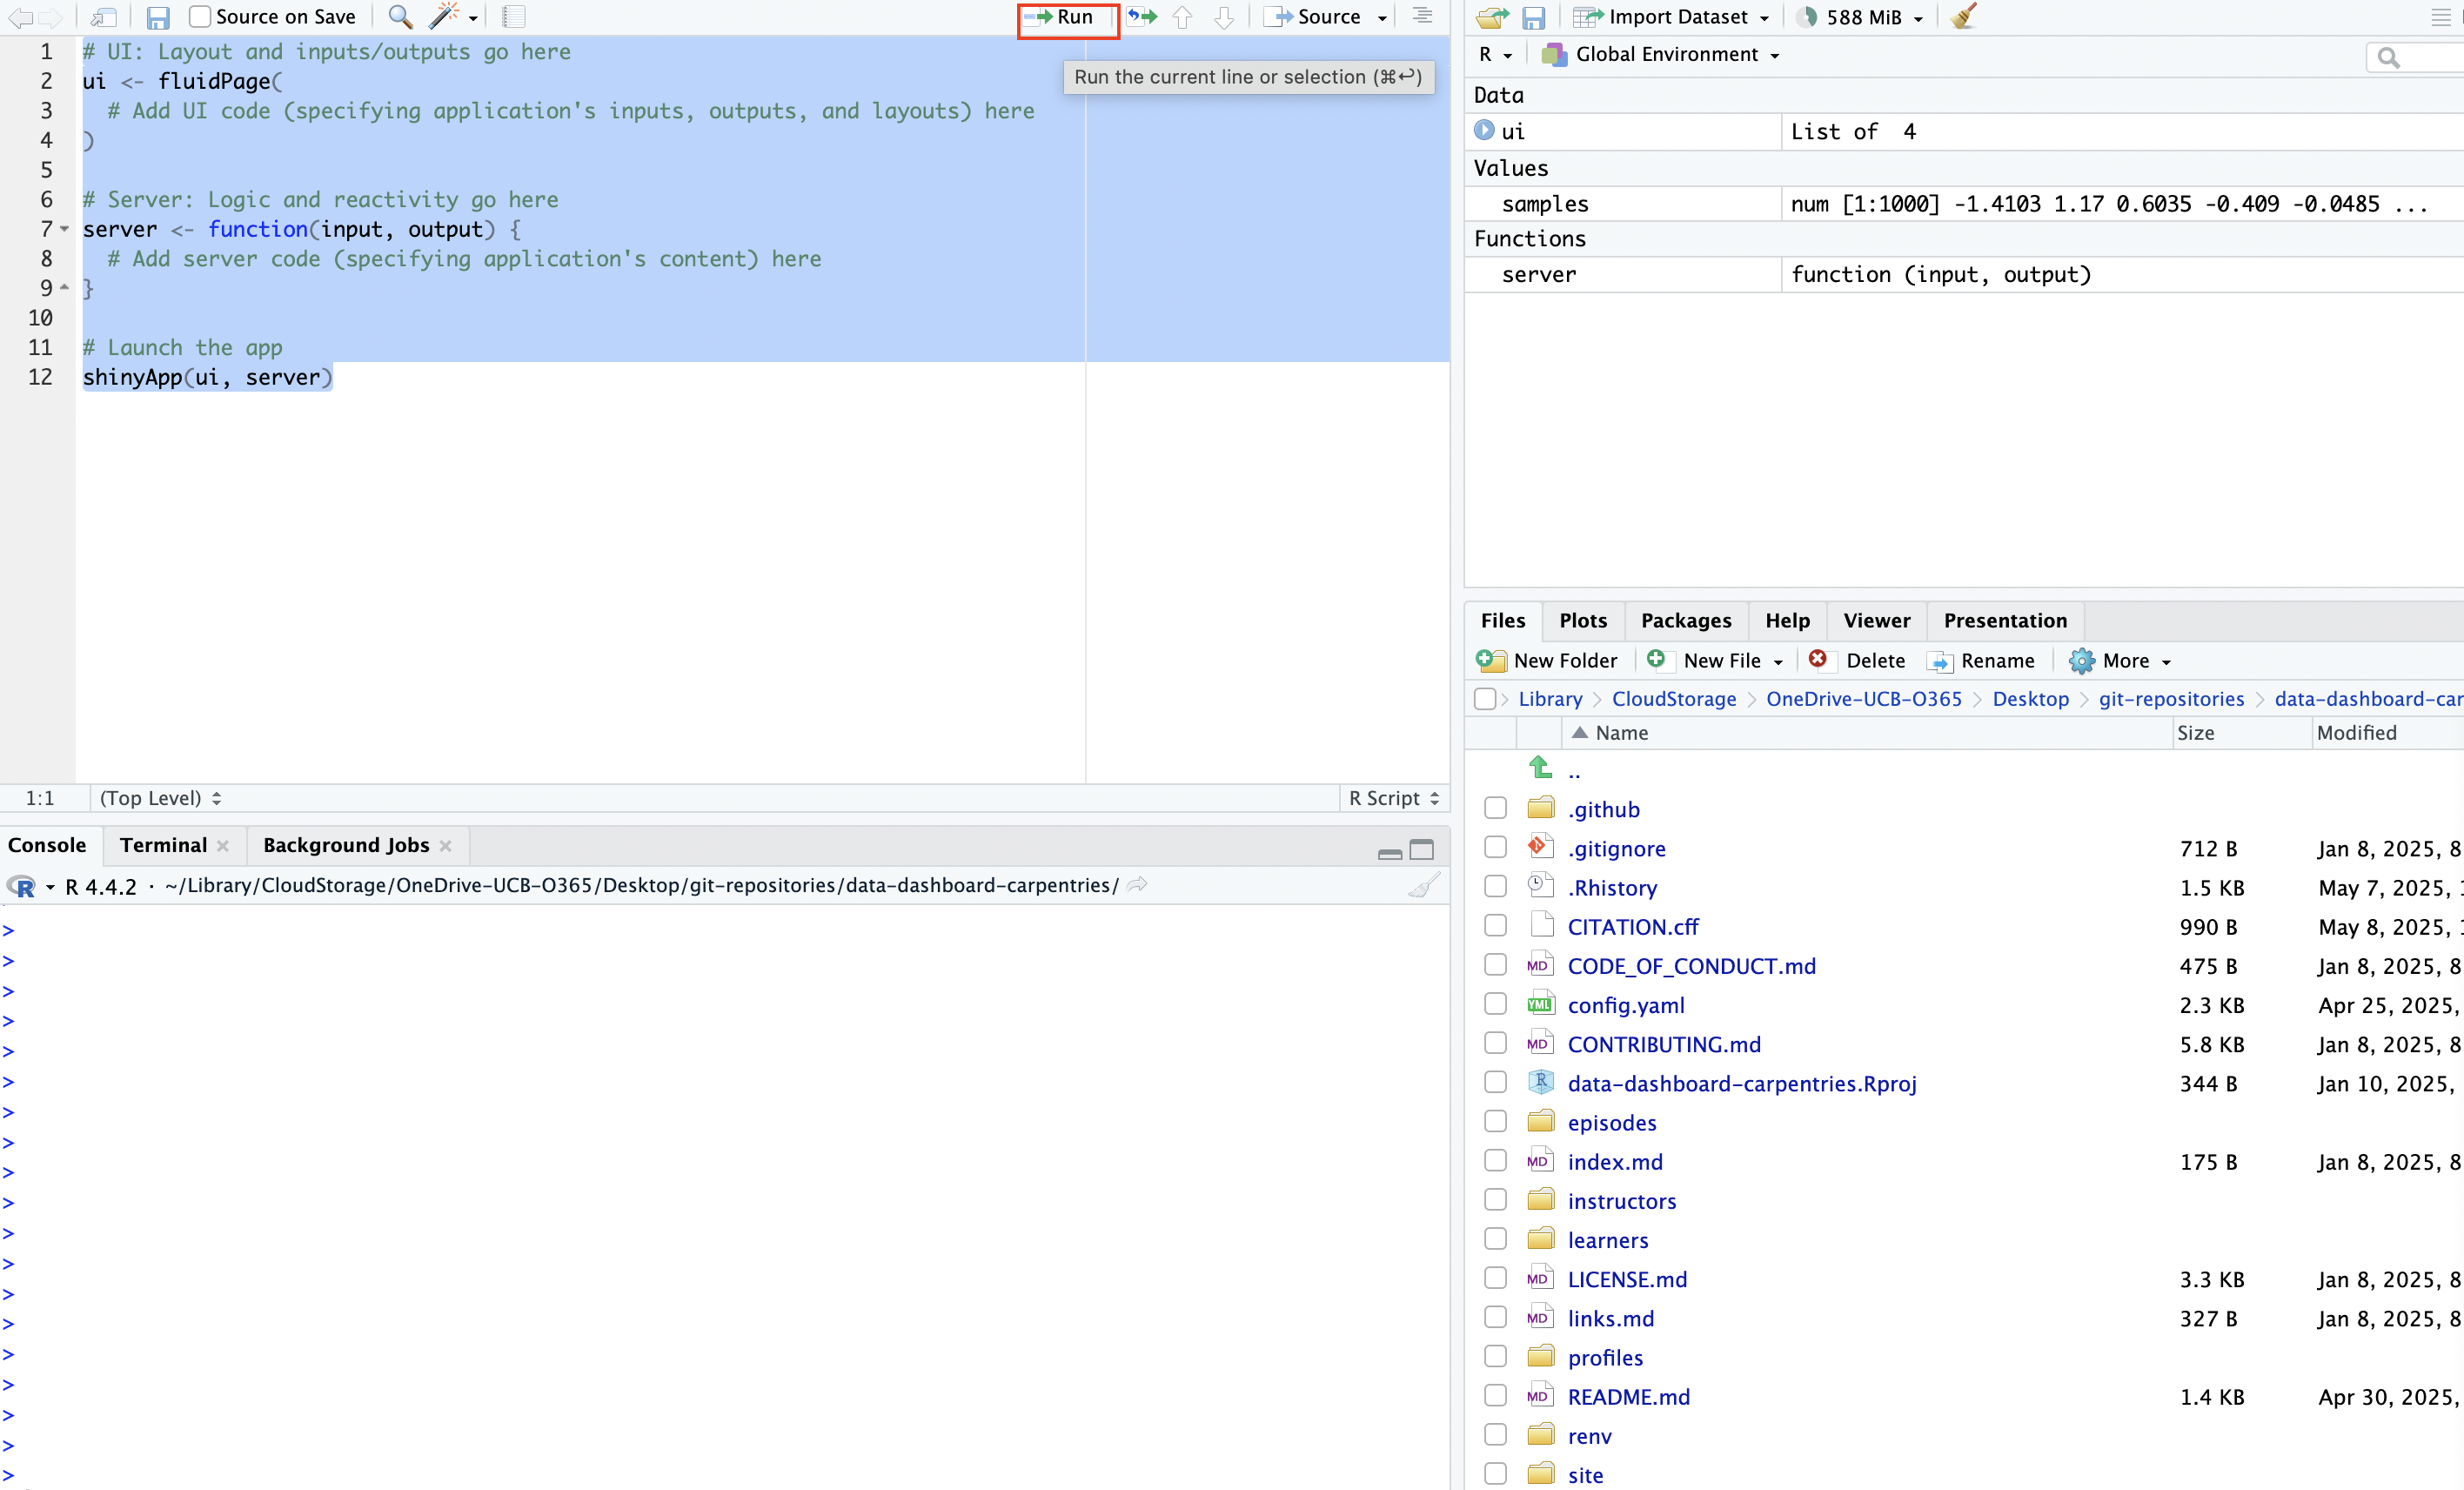 Figure 2. Launching an App
Image 1 of 1: ‘Figure 3. A Blank Application’
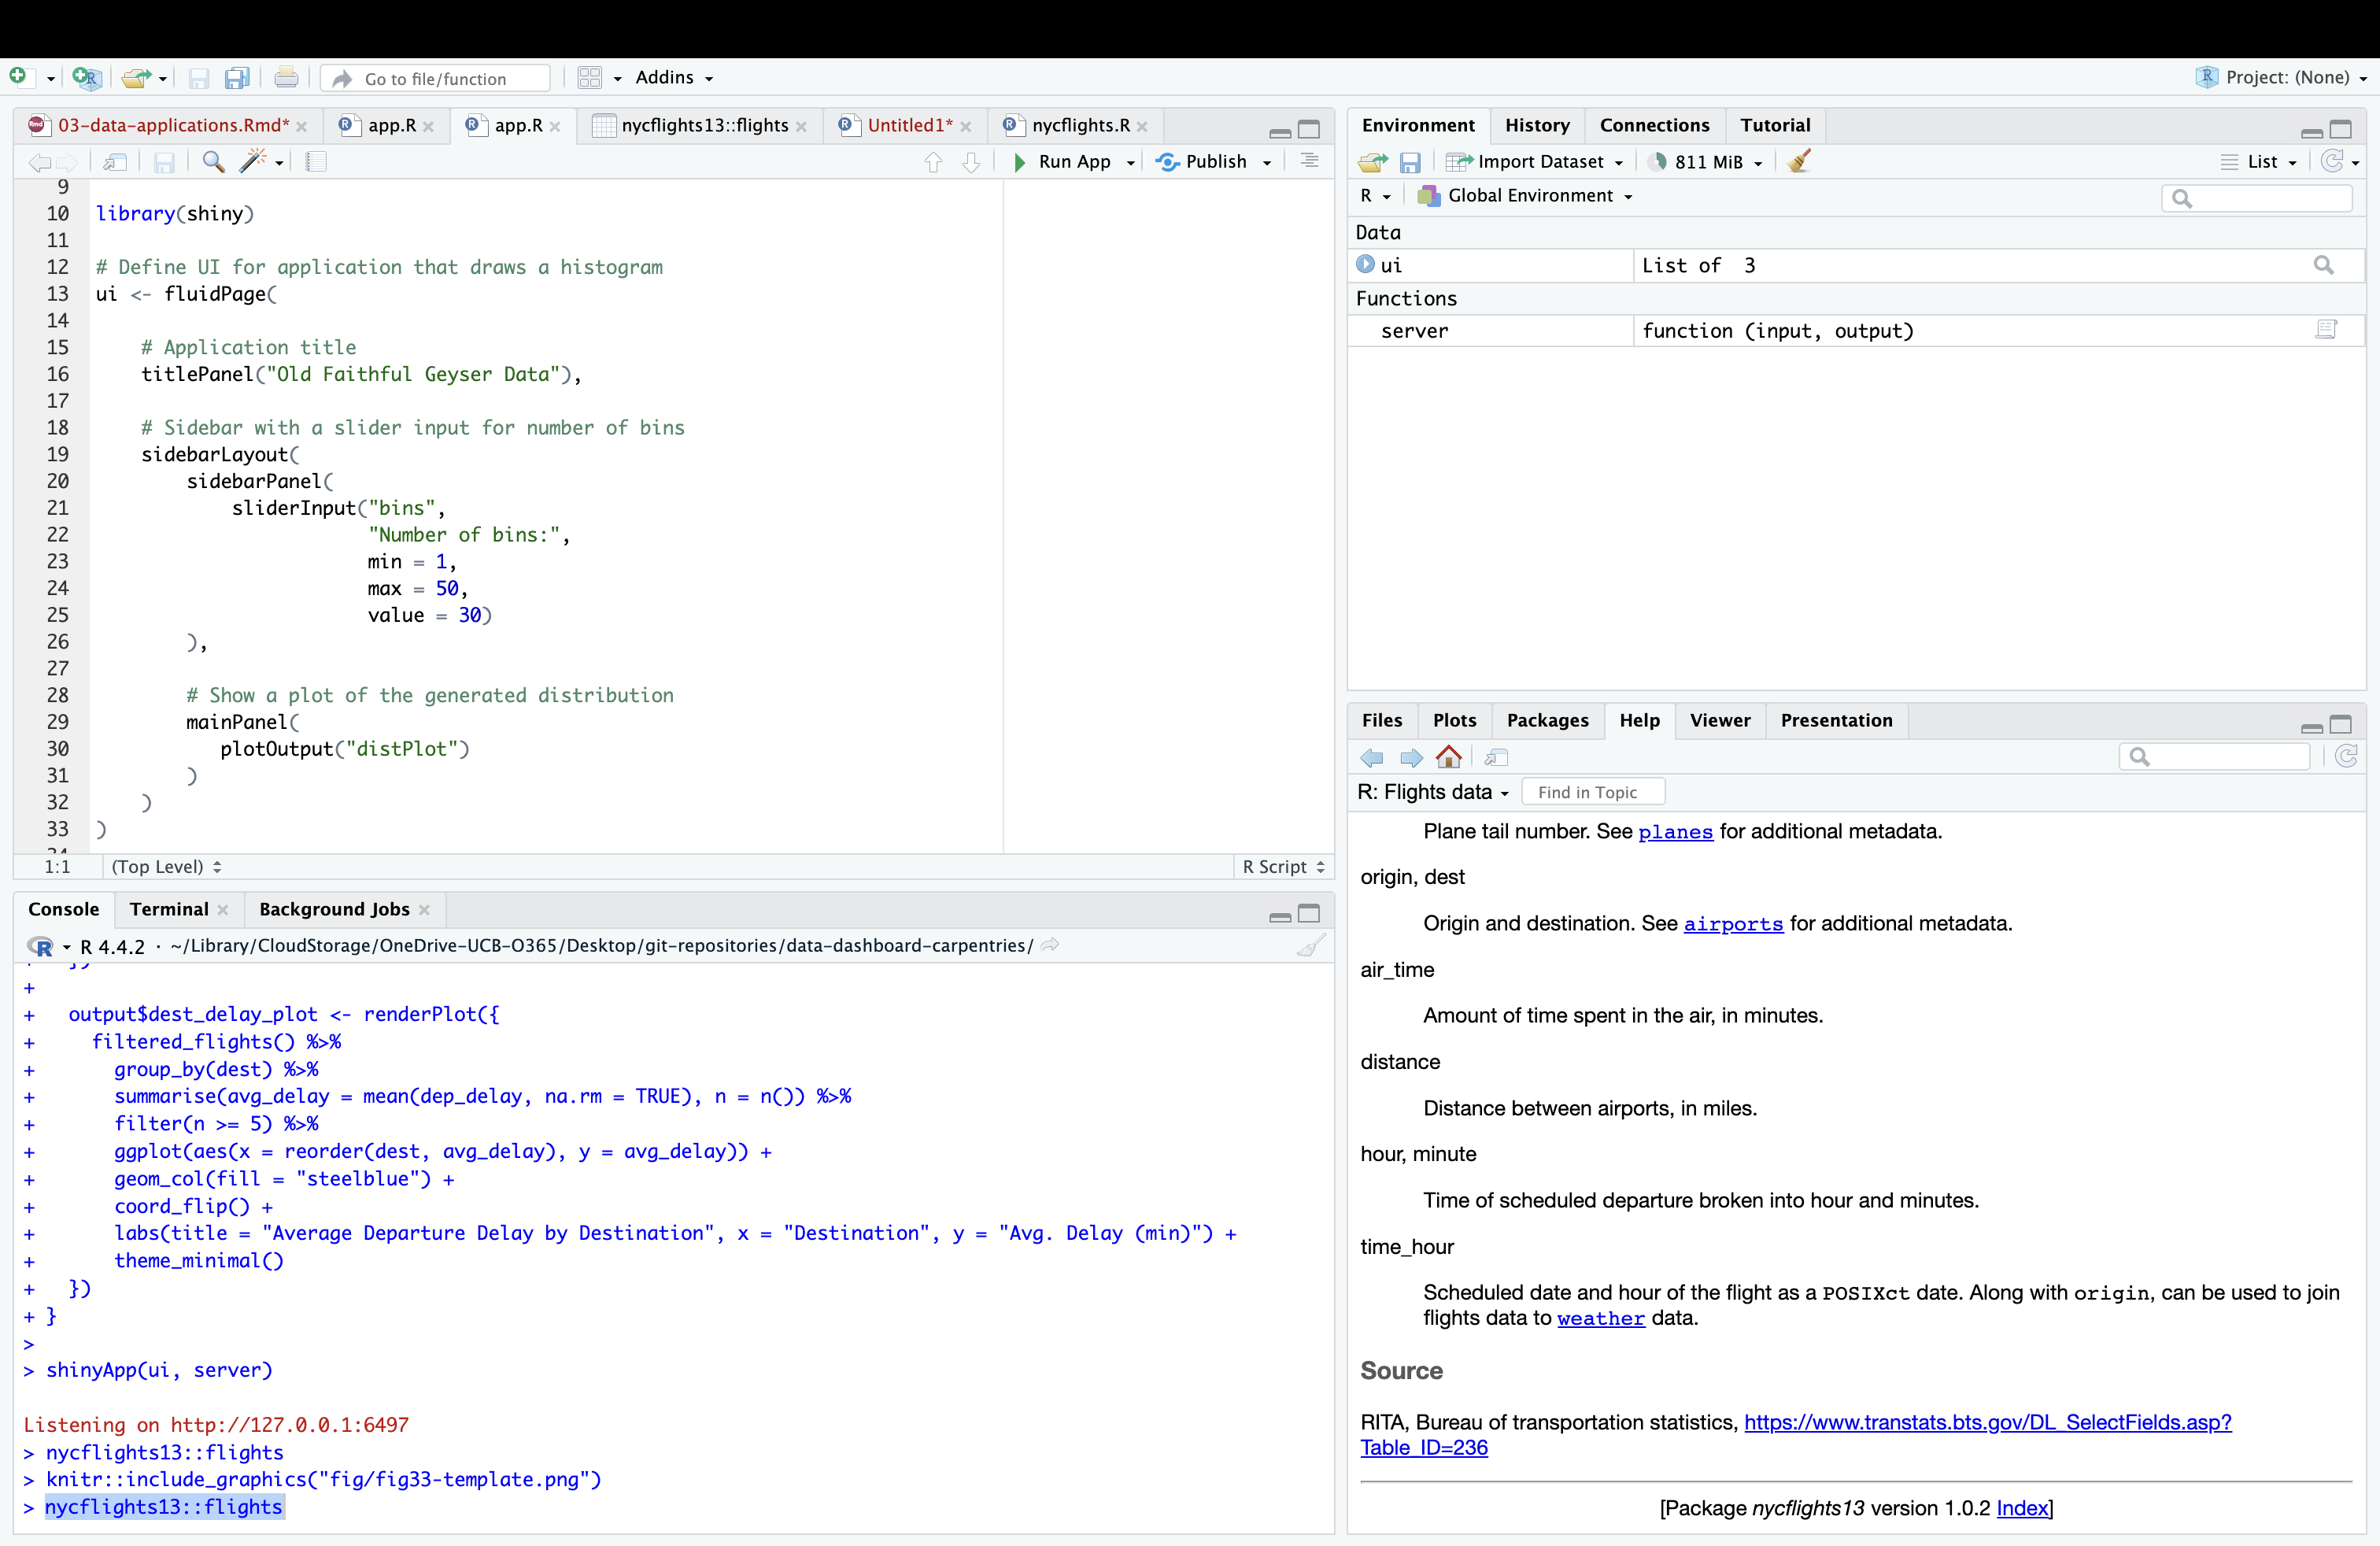
 Figure 3. A Blank Application
Image 1 of 1: ‘Figure 4. The 'Hello, World!' Application’
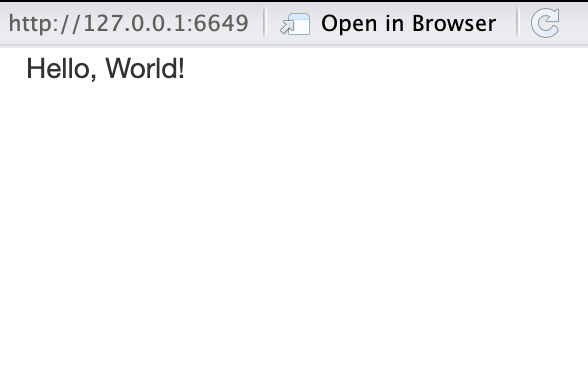 Figure 4. The ‘Hello, World!’ Application
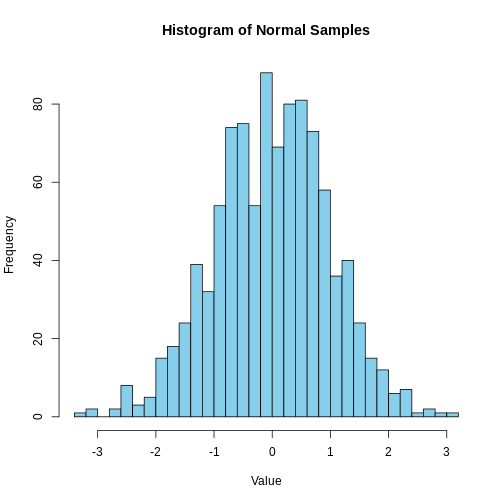
Image 1 of 1: ‘Figure 5. The Normal Plot Application’
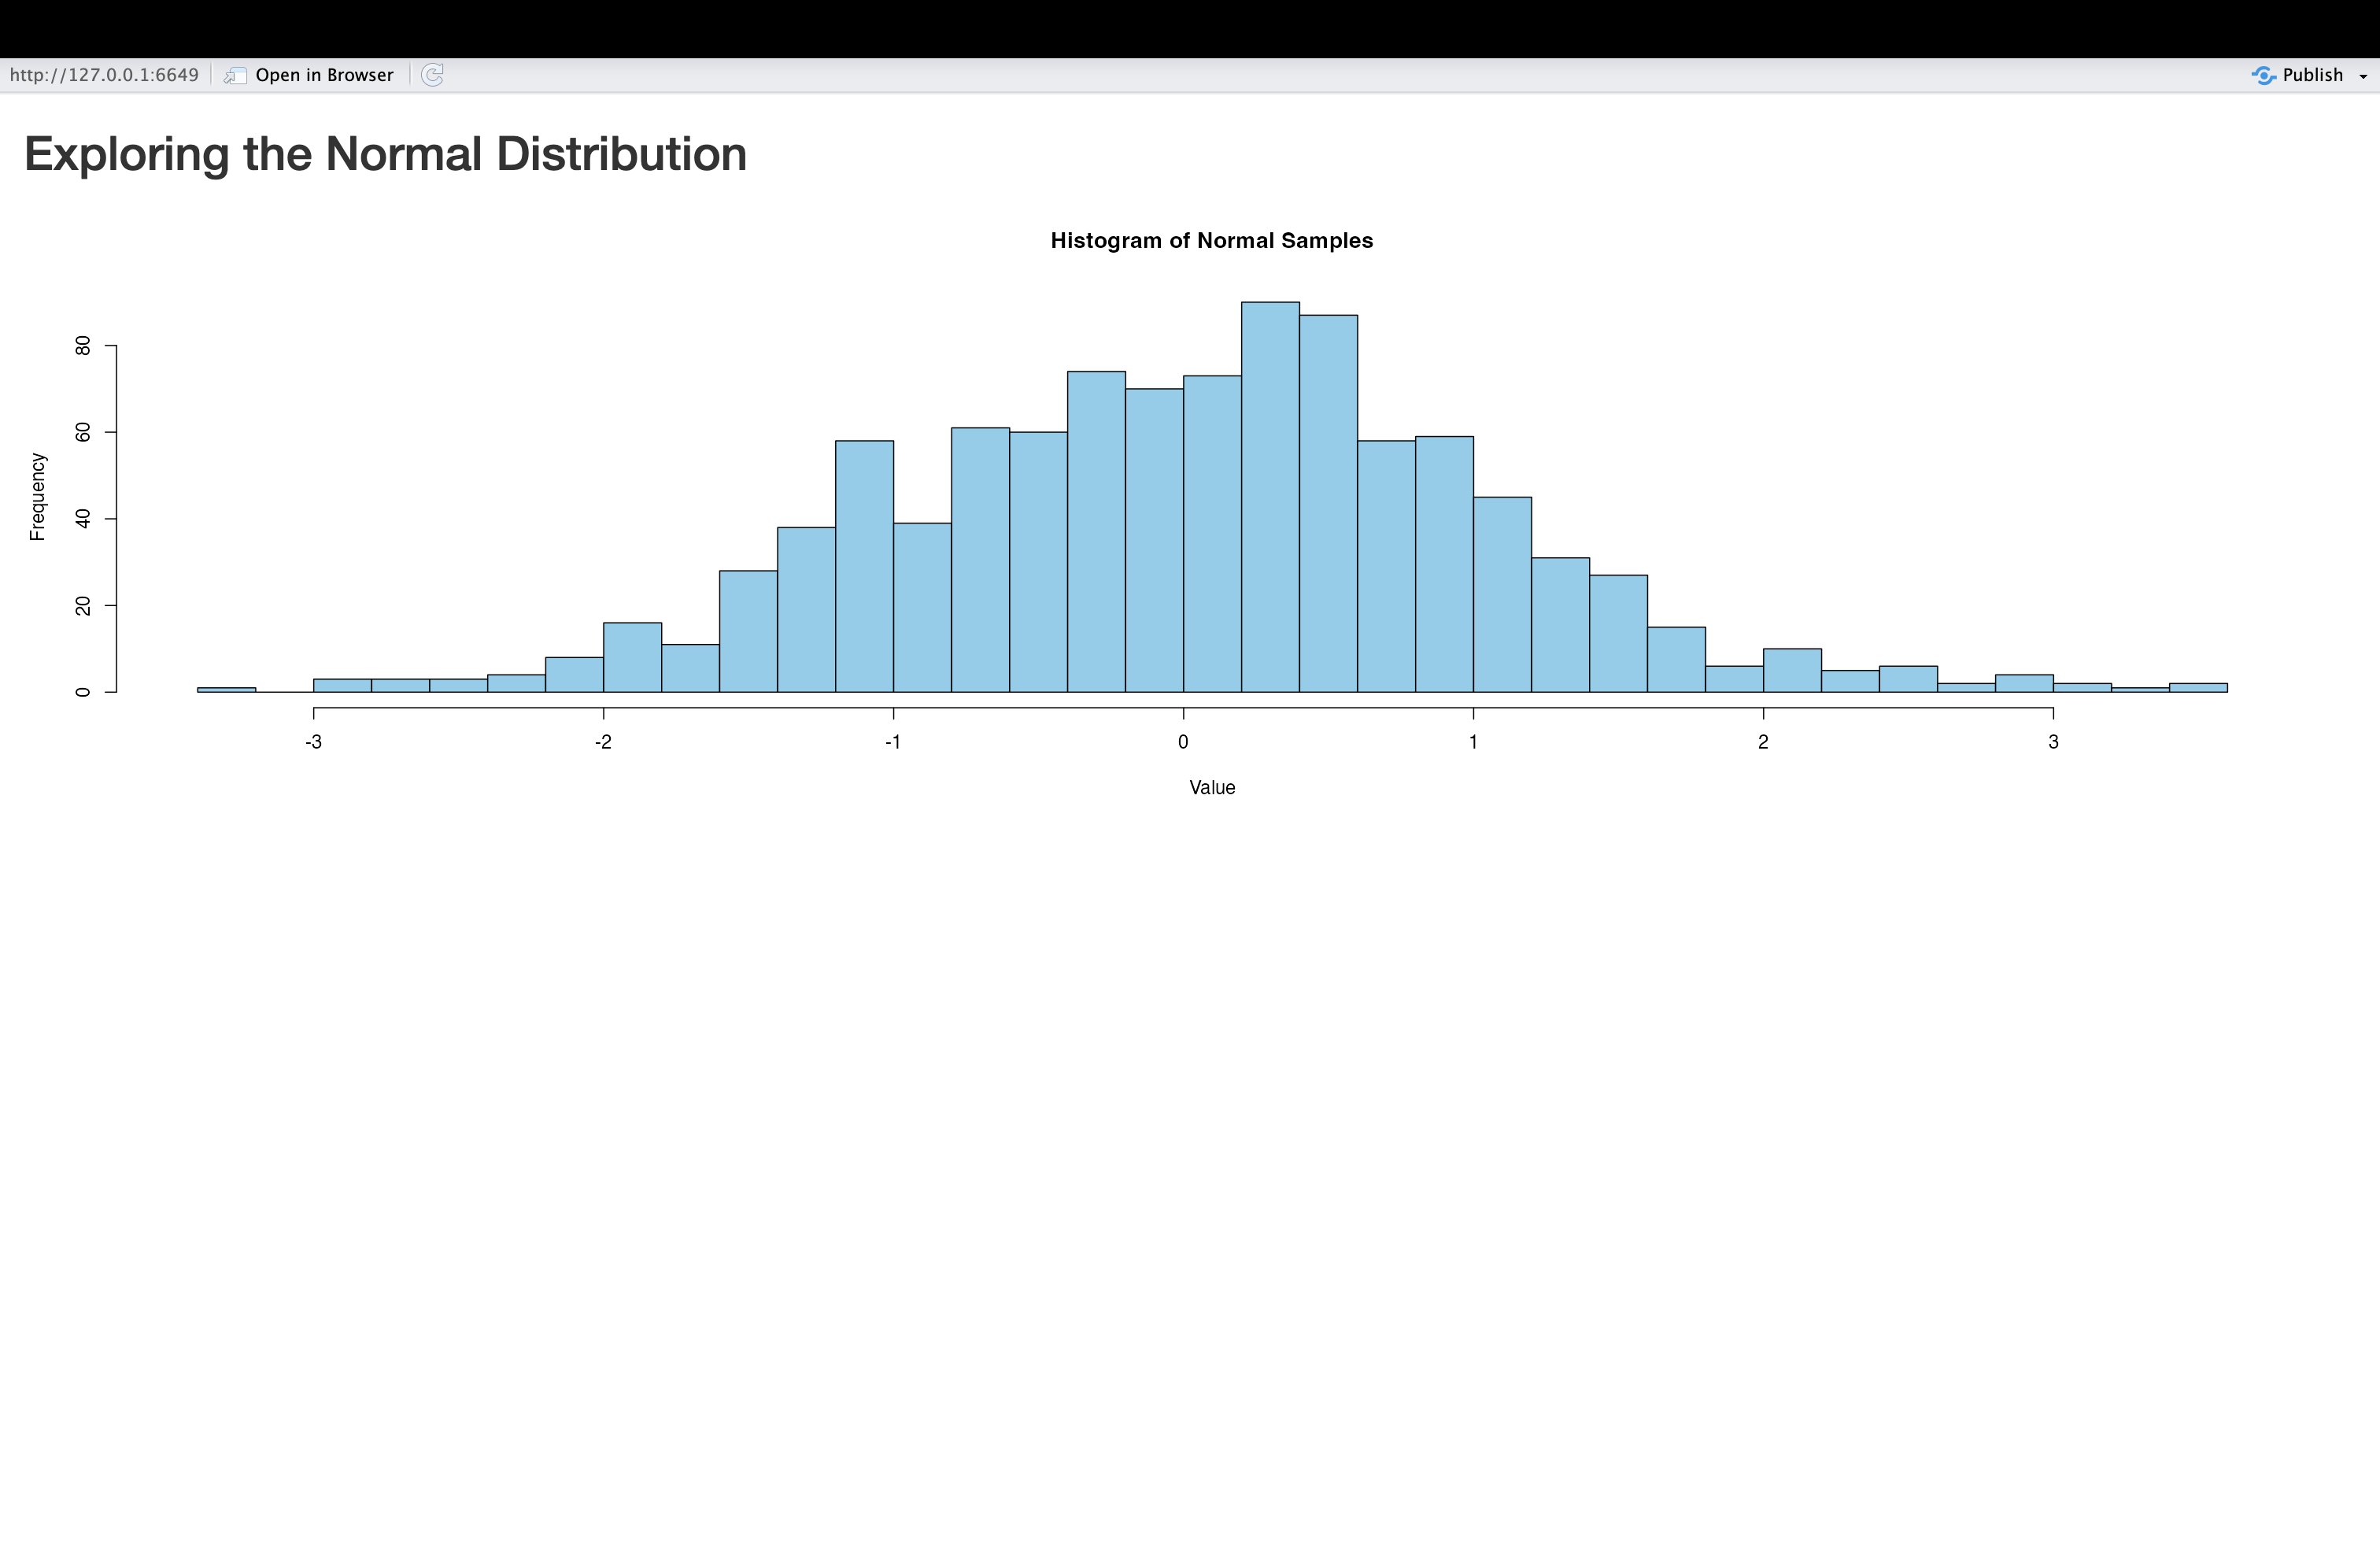 Figure 5. The Normal Plot Application
Image 1 of 1: ‘Figure 6. The Normal Plot Application With Text’
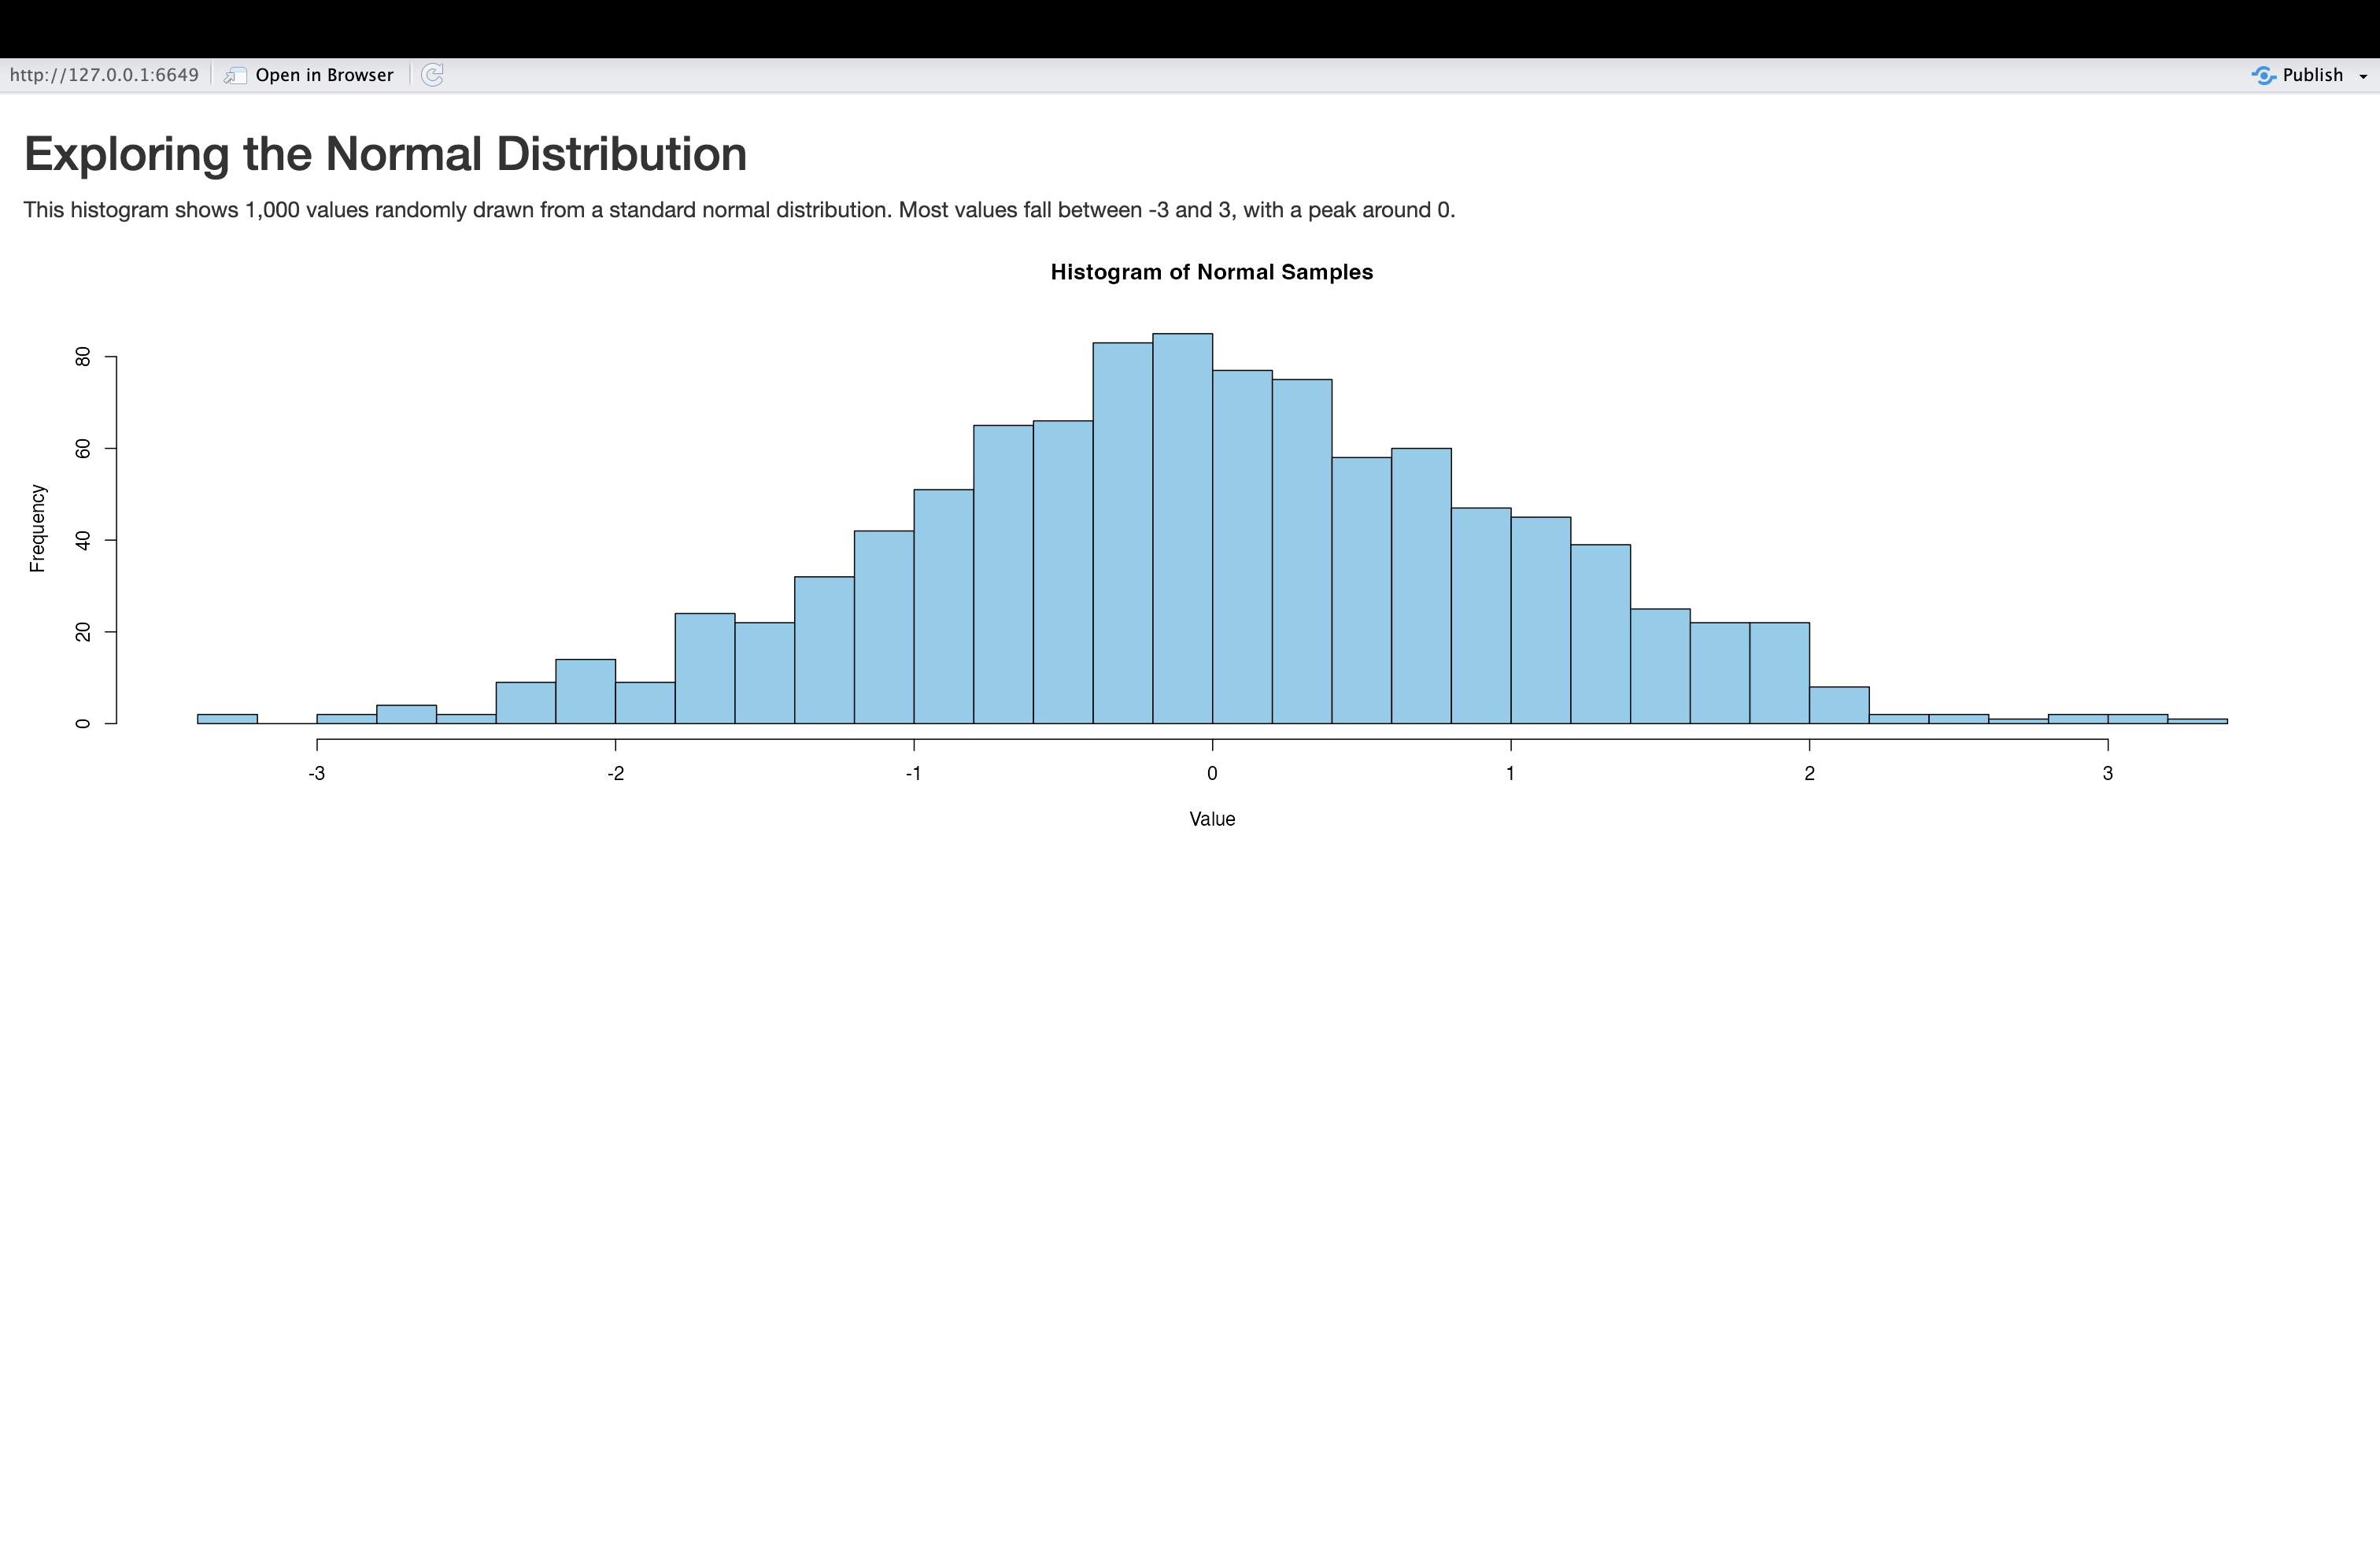 Figure 6. The Normal Plot Application With Text
Image 1 of 1: ‘Figure 7. The Interactive Greeting App with Default Value’
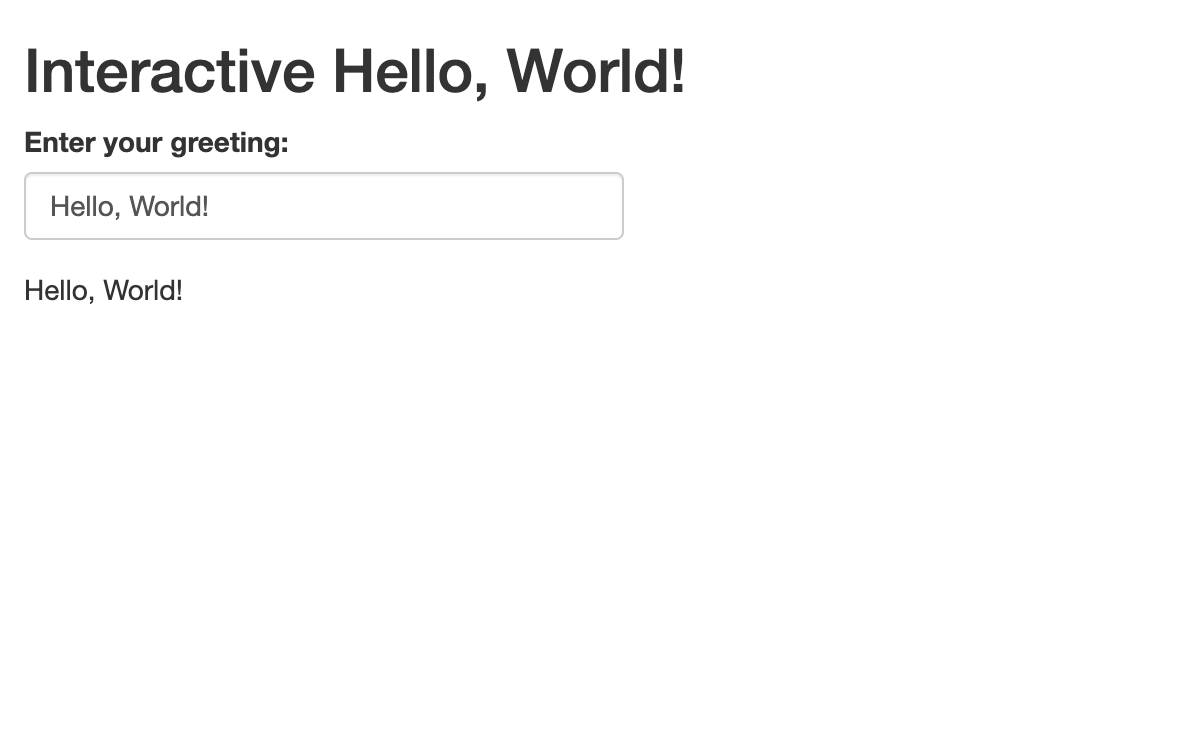 Figure 7. The Interactive Greeting App with Default Value
Image 1 of 1: ‘Figure 8. The Interactive Greeting App with a new user-supplied input’
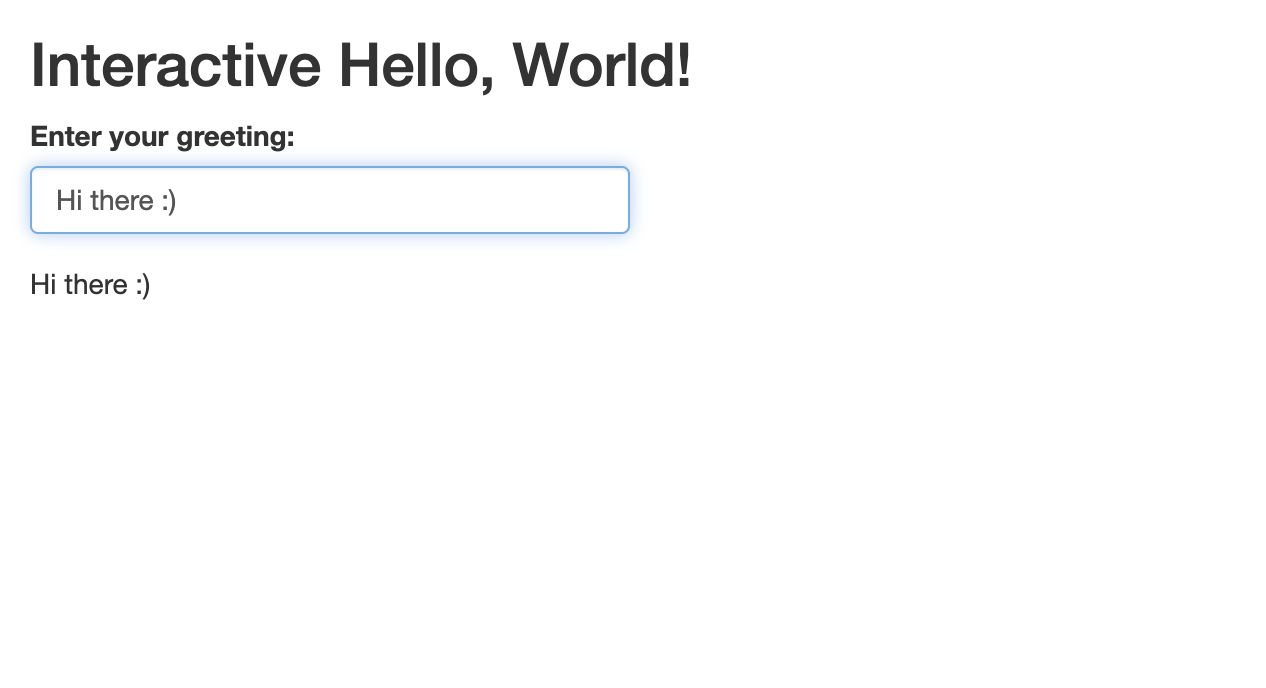 Figure 8. The Interactive Greeting App with a new user-supplied input
Image 1 of 1: ‘Figure 9. The Interactive Greeting App with dropdown Menu’
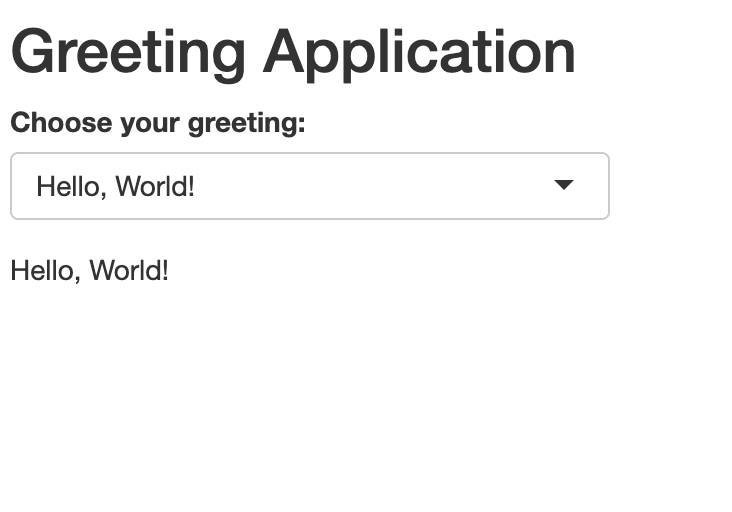 Figure 9. The Interactive Greeting App with dropdown Menu
Image 1 of 1: ‘Figure 10. Selecting an option from the interactive greeting app's dropdown menu’
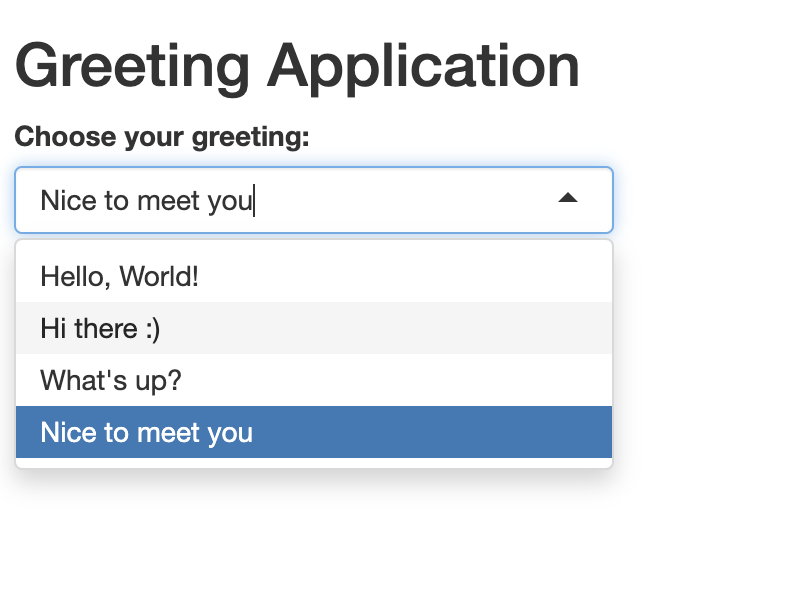 Figure 10. Selecting an option from the interactive greeting app’s
dropdown menu
Figure 10. Selecting an option from the interactive greeting app’s
dropdown menu
Image 1 of 1: ‘Figure 11. Text output after selecting an input from the dropdown menu’
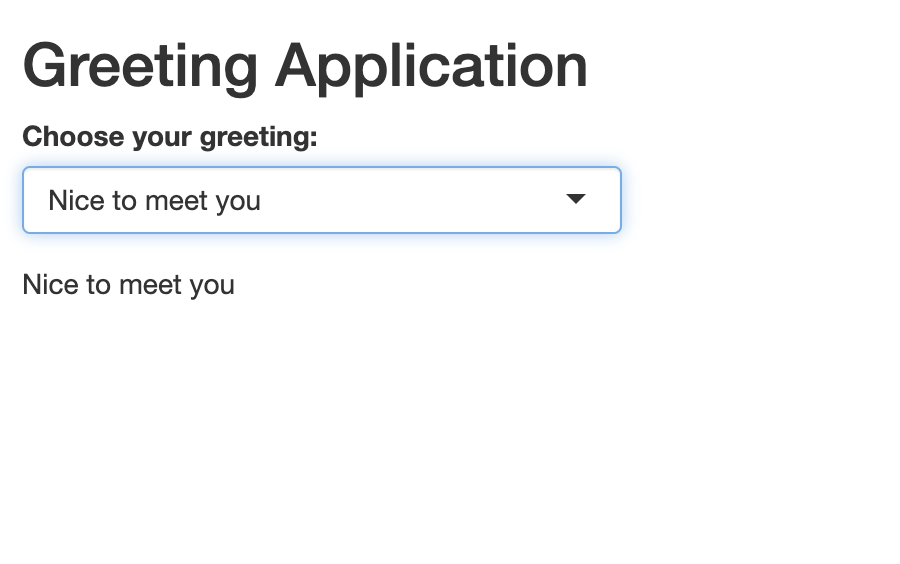 Figure 11. Text output after selecting an input from the dropdown menu
Image 1 of 1: ‘Figure 12. Greeting App with Radio Buttons’
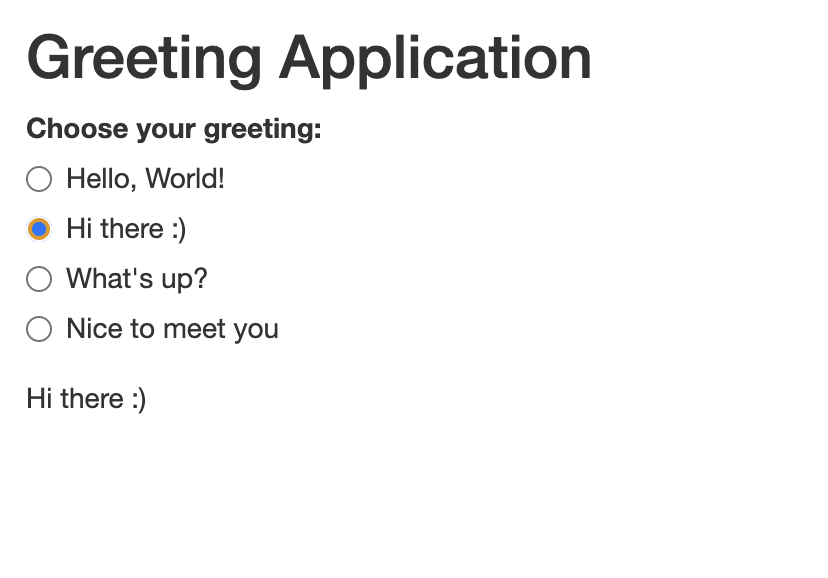 Figure 12. Greeting App with Radio Buttons
Image 1 of 1: ‘Figure 13. Personal Greeting App’
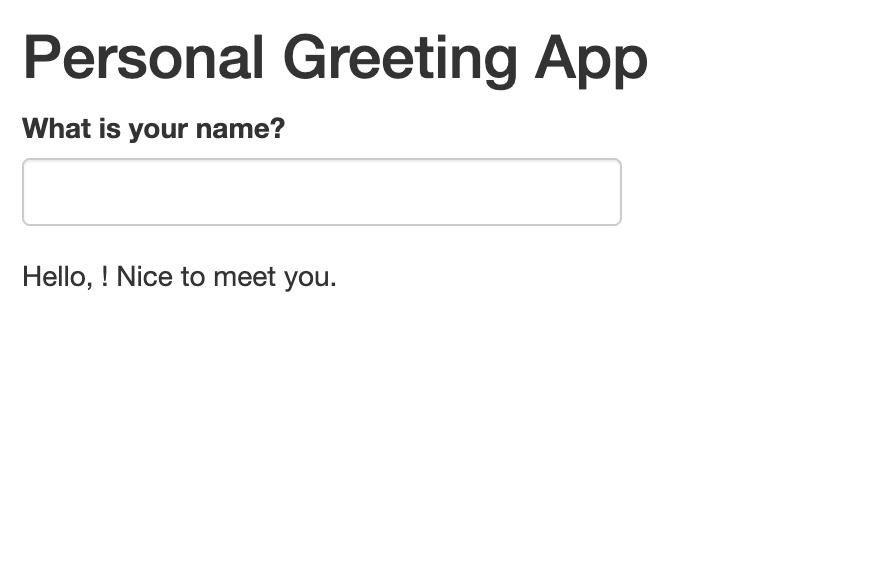 Figure 13. Personal Greeting App
Image 1 of 1: ‘Figure 14. Personal Greeting App Output’
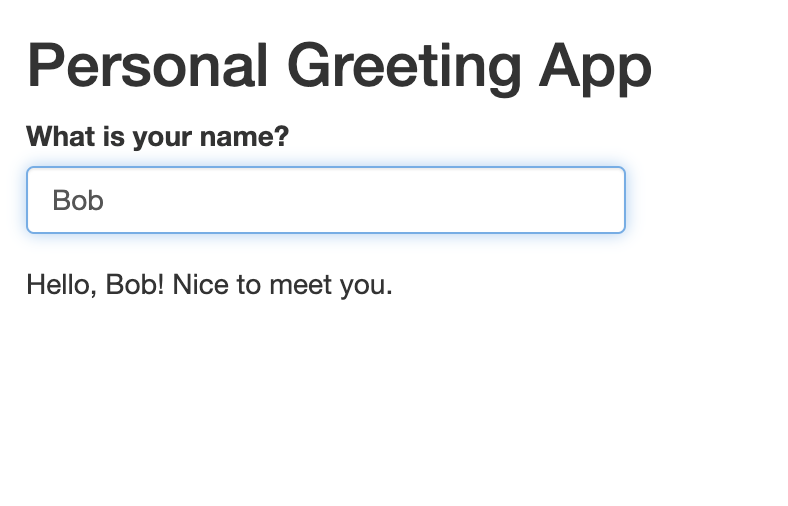 Figure 14. Personal Greeting App Output
Image 1 of 1: ‘Figure 15. Launching the Revised Personal Greeting App’
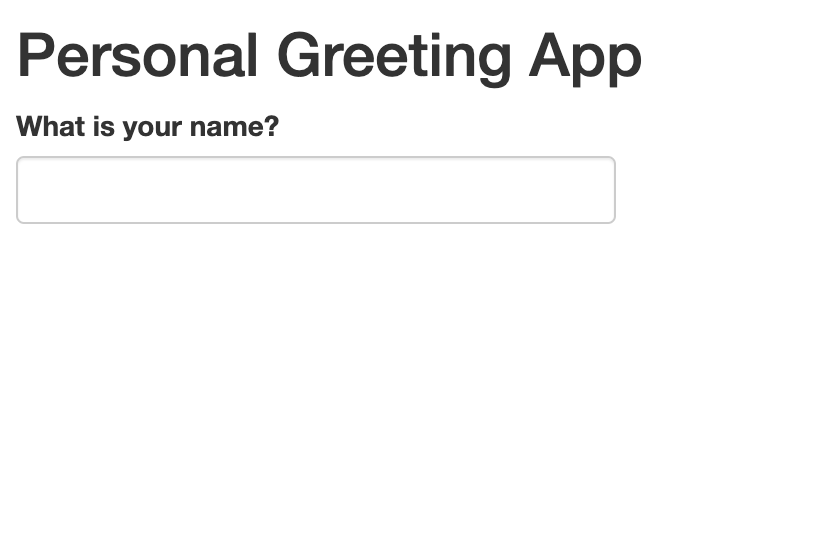 Figure 15. Launching the Revised Personal Greeting App
Image 1 of 1: ‘Figure 16. User-Prompted Output in the Revised Personal Greeting App’
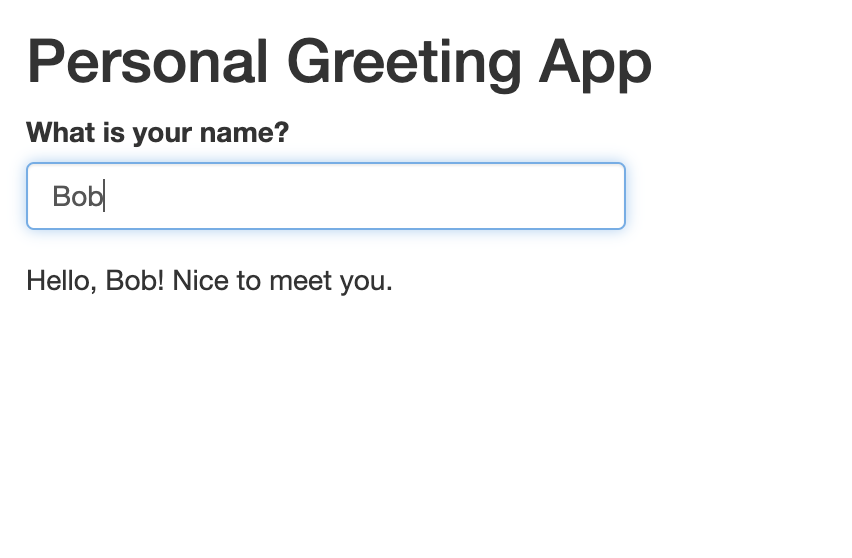 Figure 16. User-Prompted Output in the Revised Personal Greeting App
Image 1 of 1: ‘Figure 17.Carpentries Introduction App’
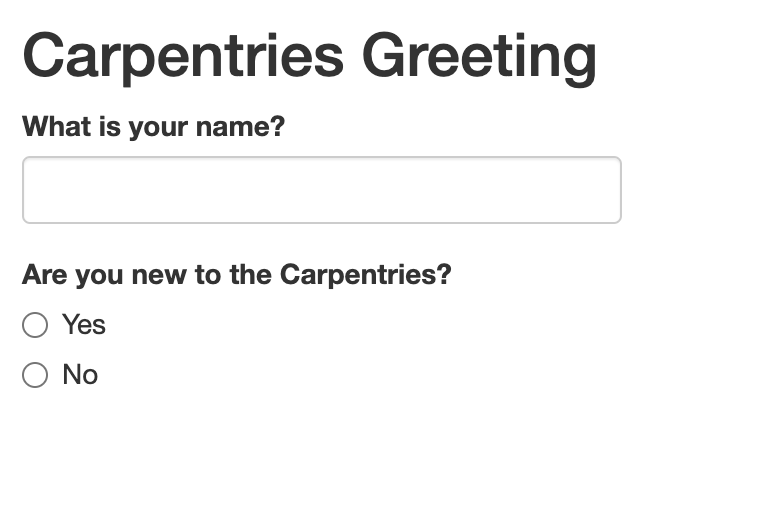 Figure 17.Carpentries Introduction App
Image 1 of 1: ‘Figure 18.Carpentries Introduction App Text Output’
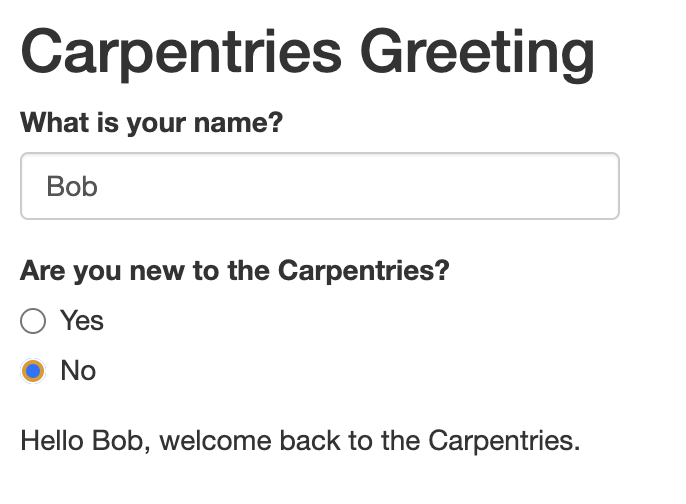 Figure 18.Carpentries Introduction App Text Output
Image 1 of 1: ‘Figure 19.Launching the interactive plot application’
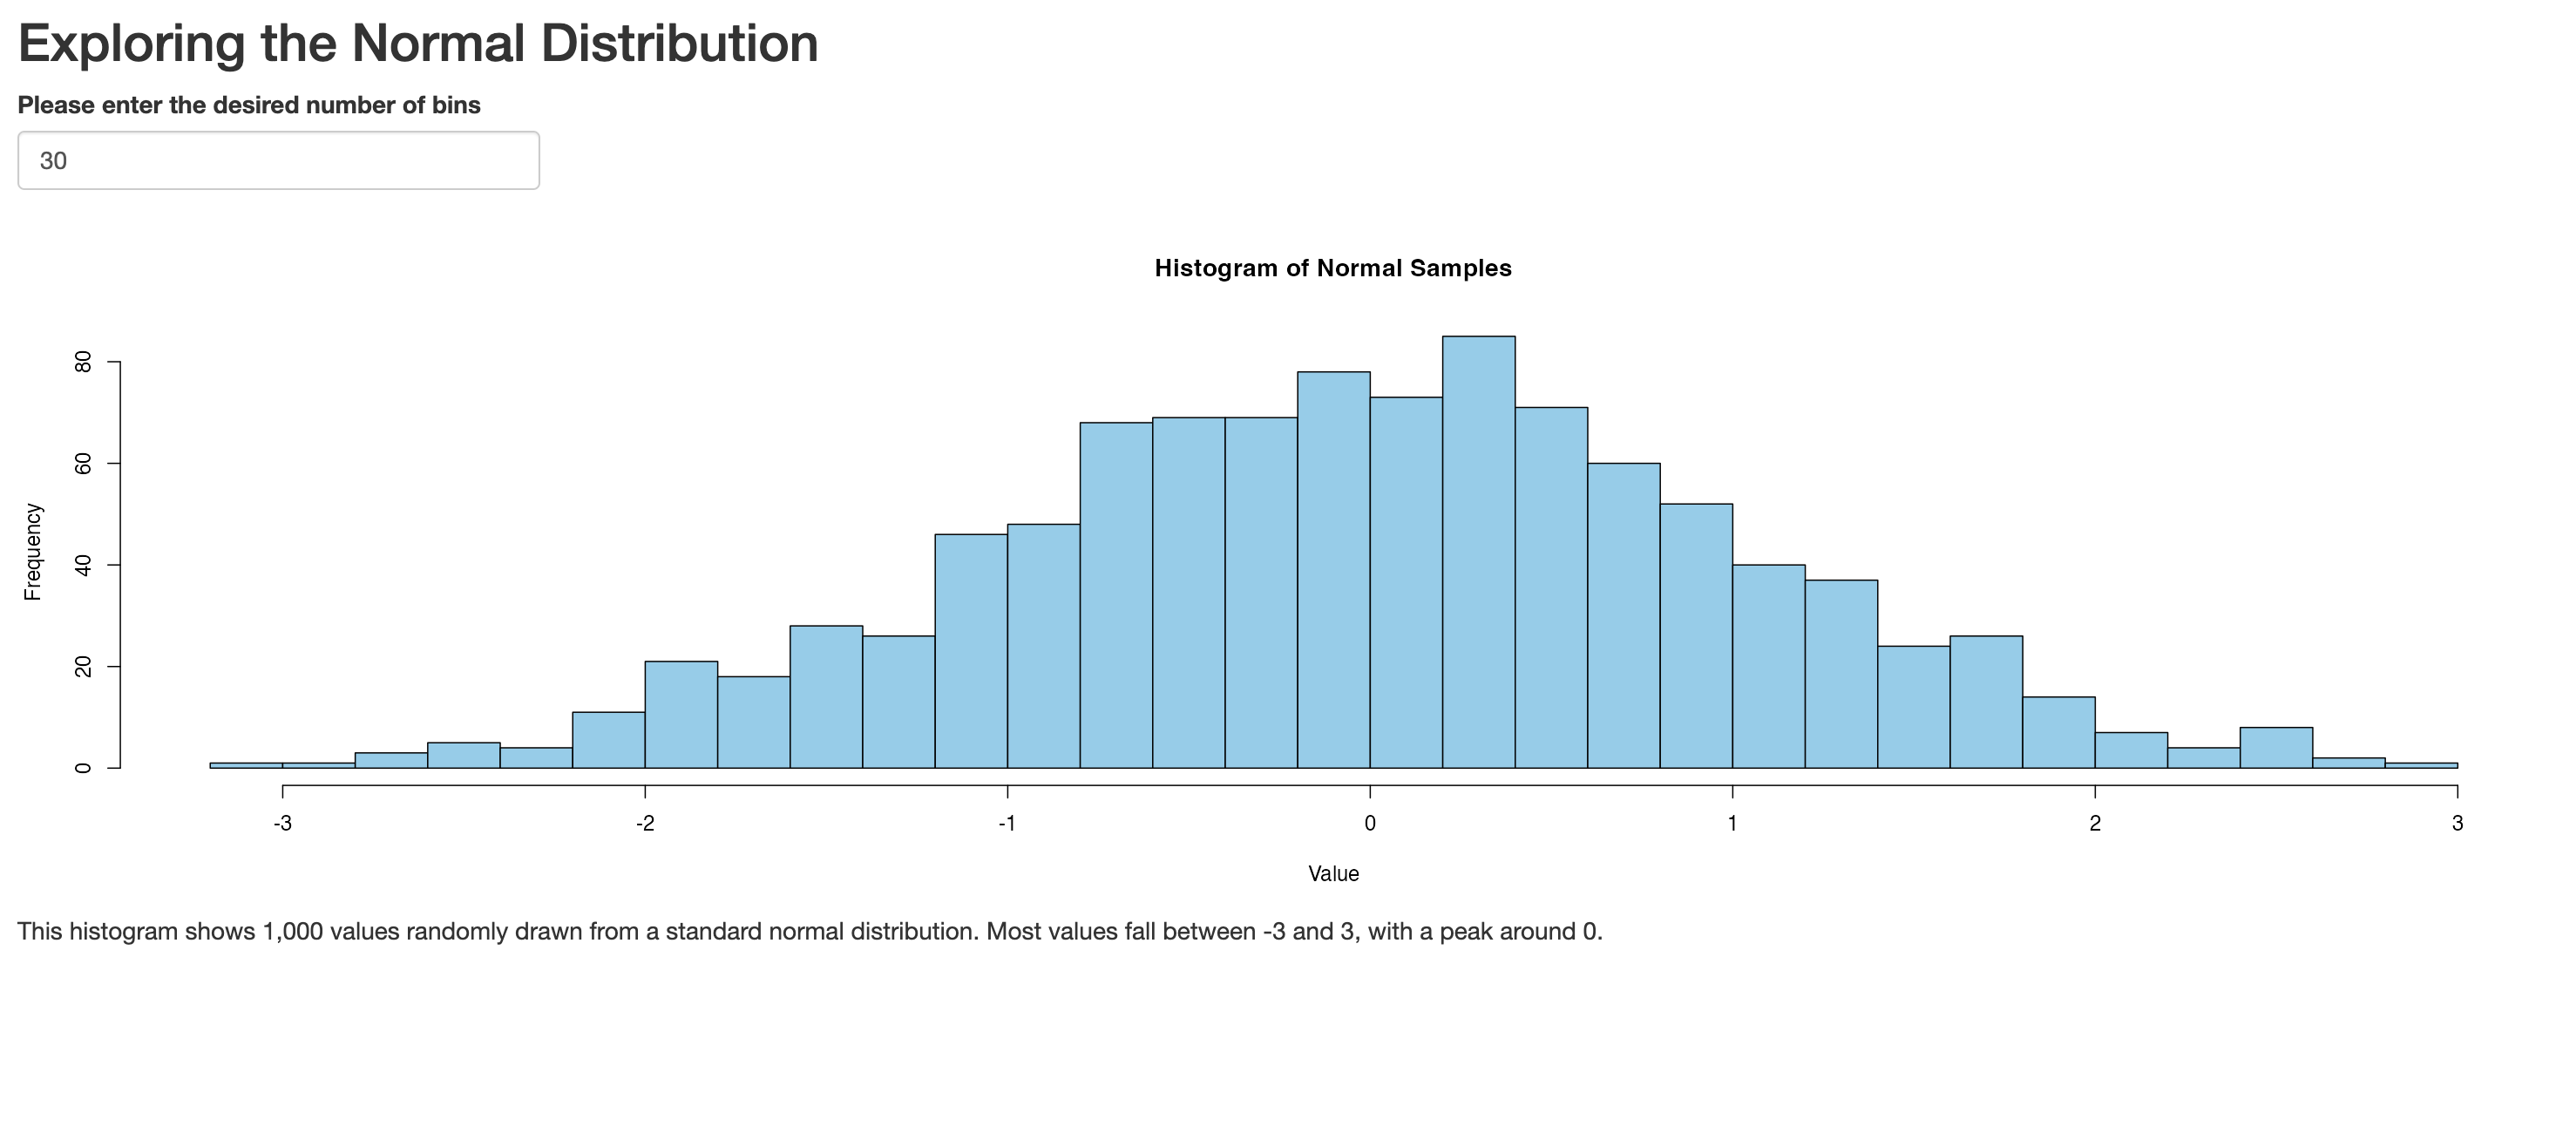 Figure 19.Launching the interactive plot application
Image 1 of 1: ‘Figure 20. Increasing the number of bins to 100’
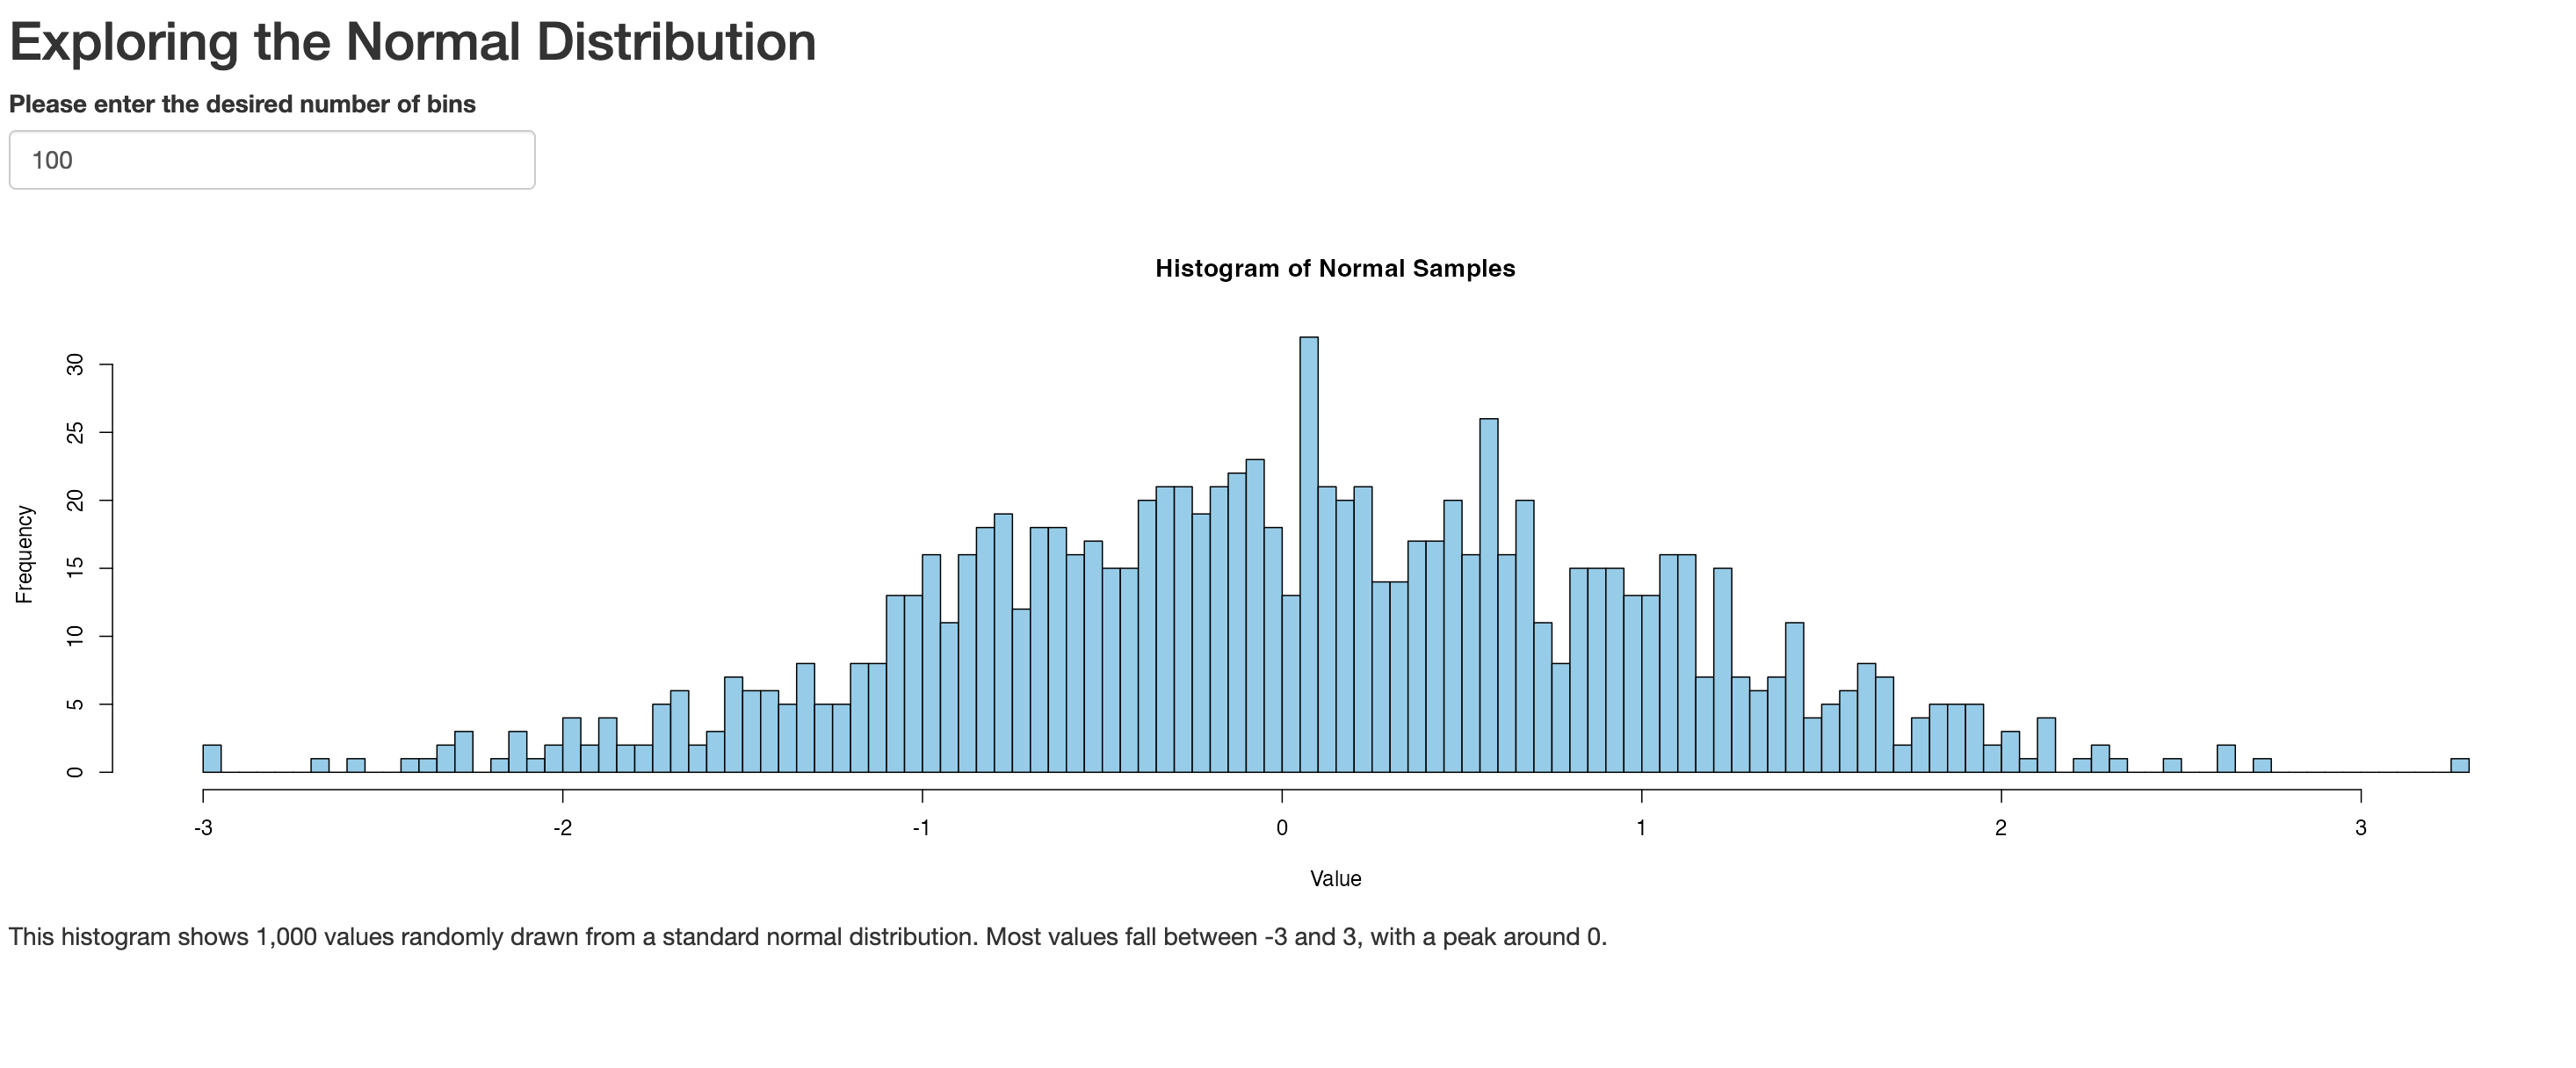 Figure 20. Increasing the number of bins to 100
Image 1 of 1: ‘Figure 21. Interactively changing number of bins and colors’
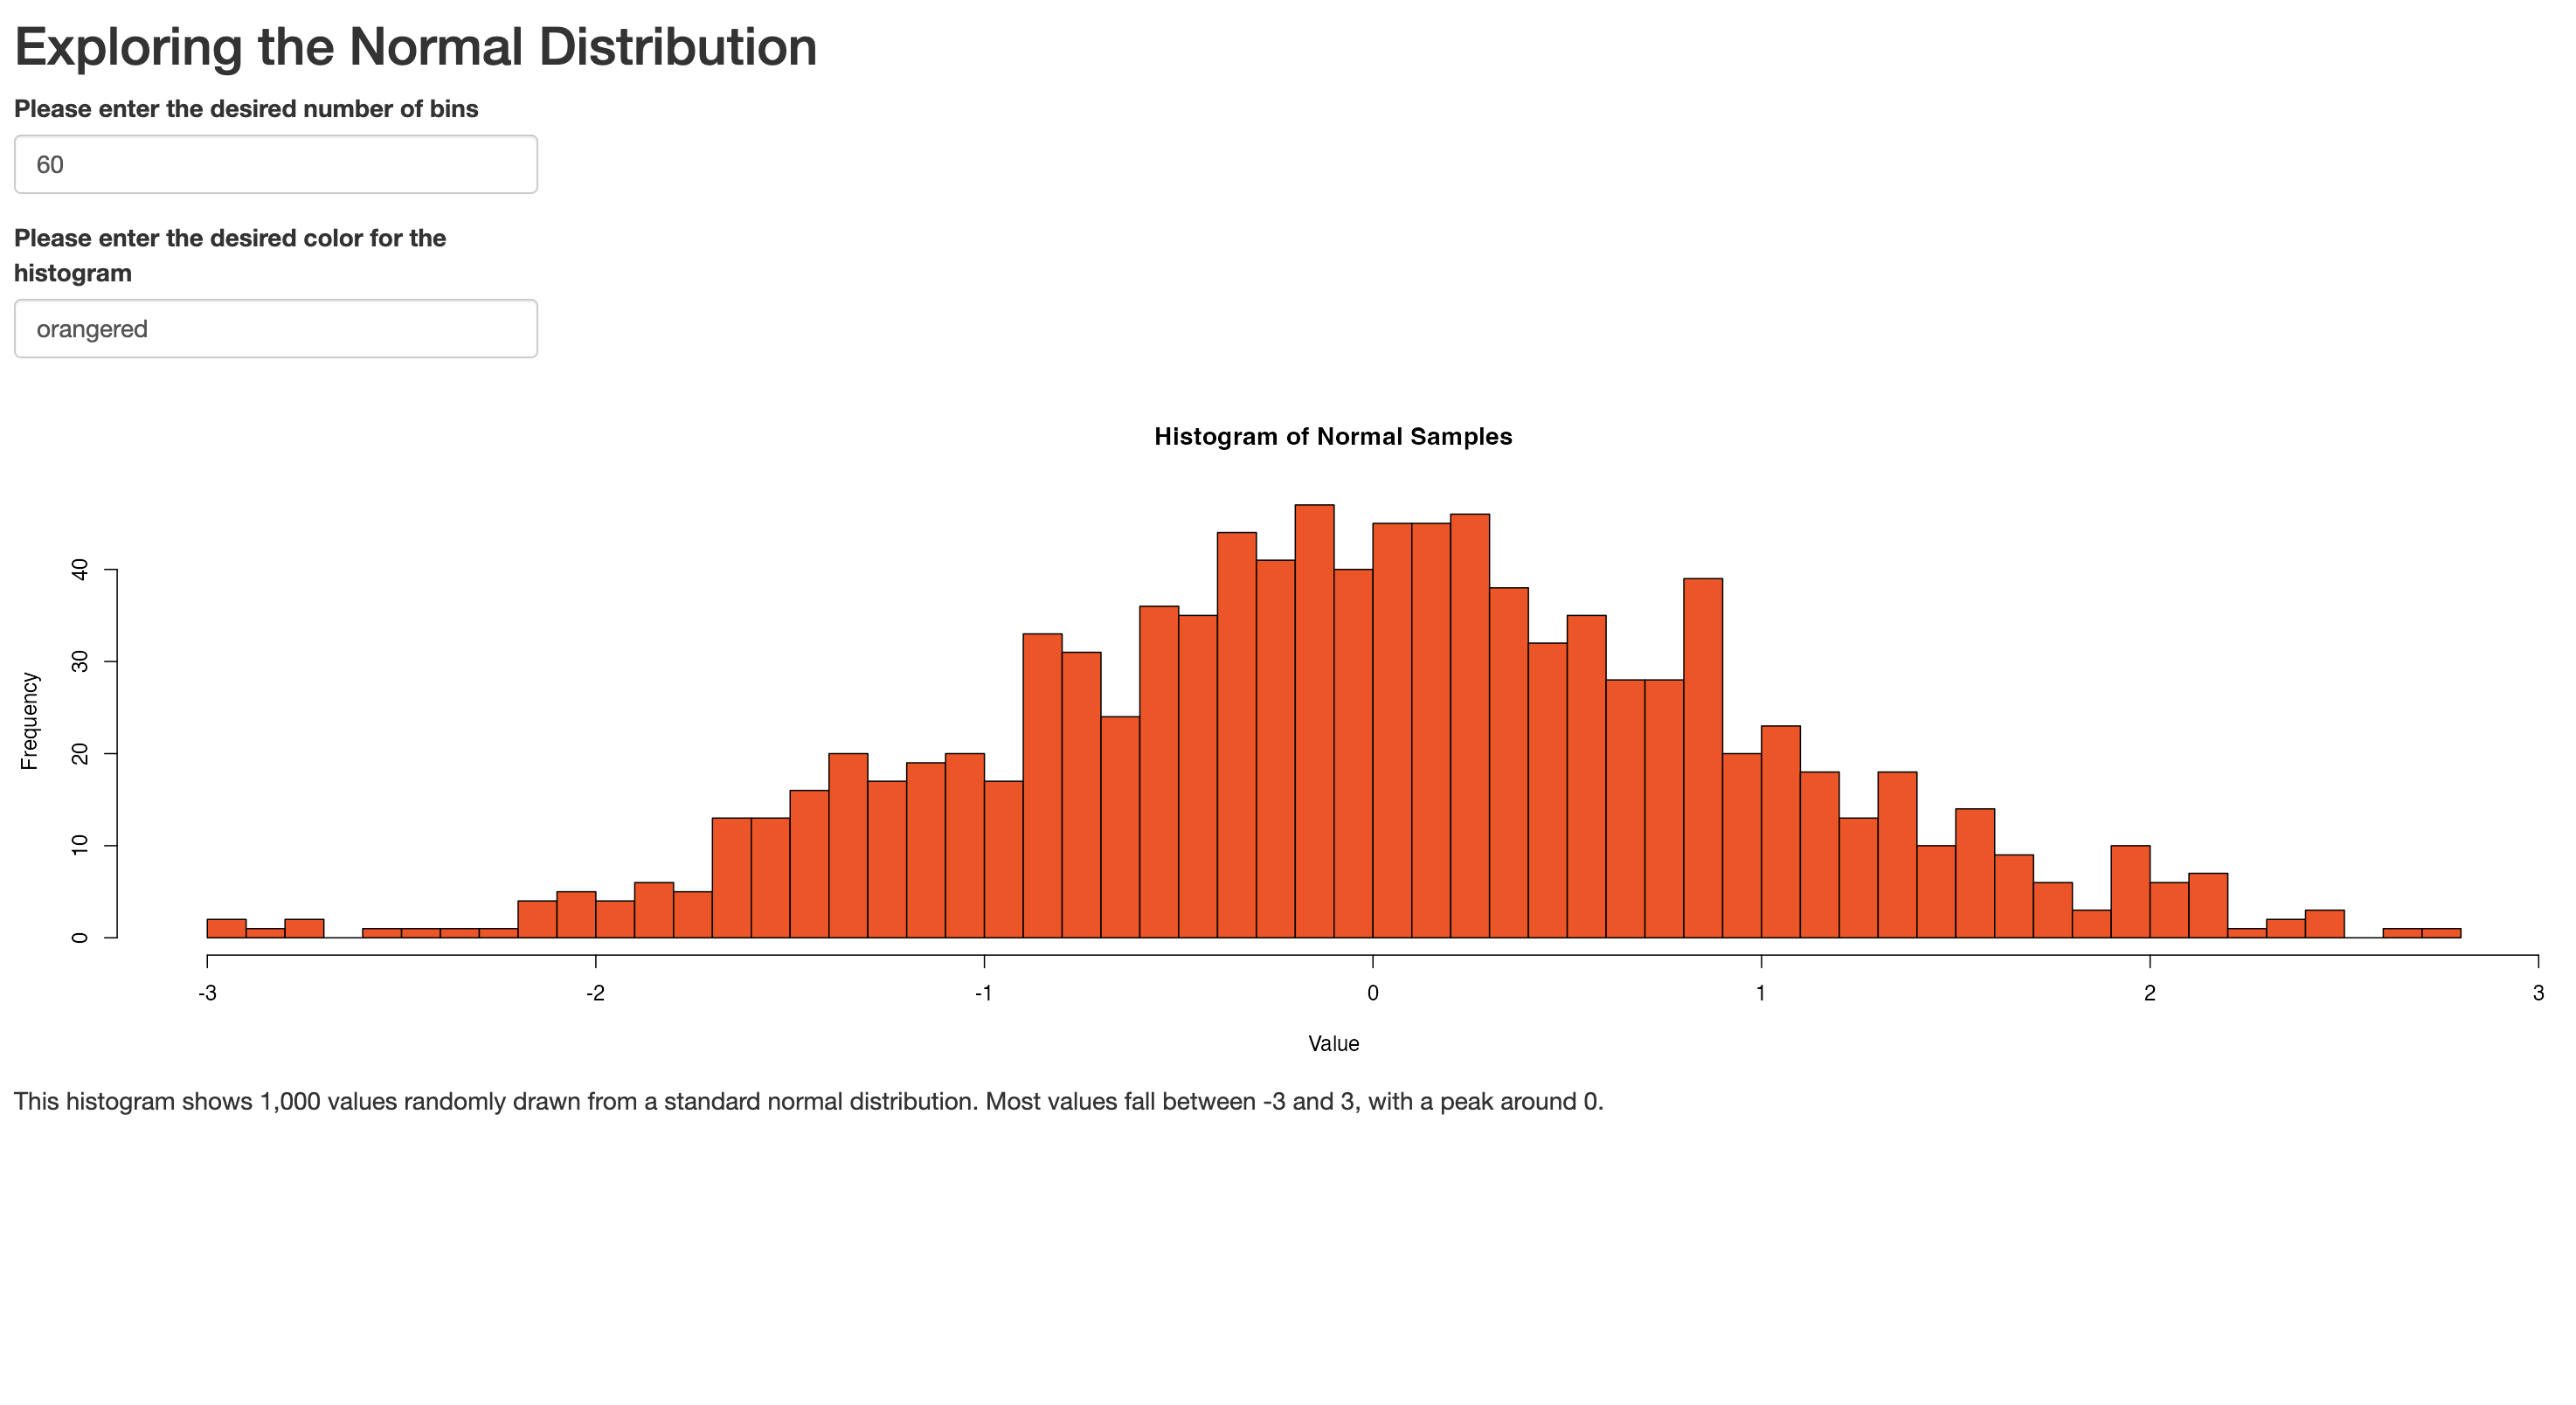 Figure 21. Interactively changing number of bins and colors
Image 1 of 1: ‘Figure 21. Interactive plot with user inputs for color, number of bins, and mean’
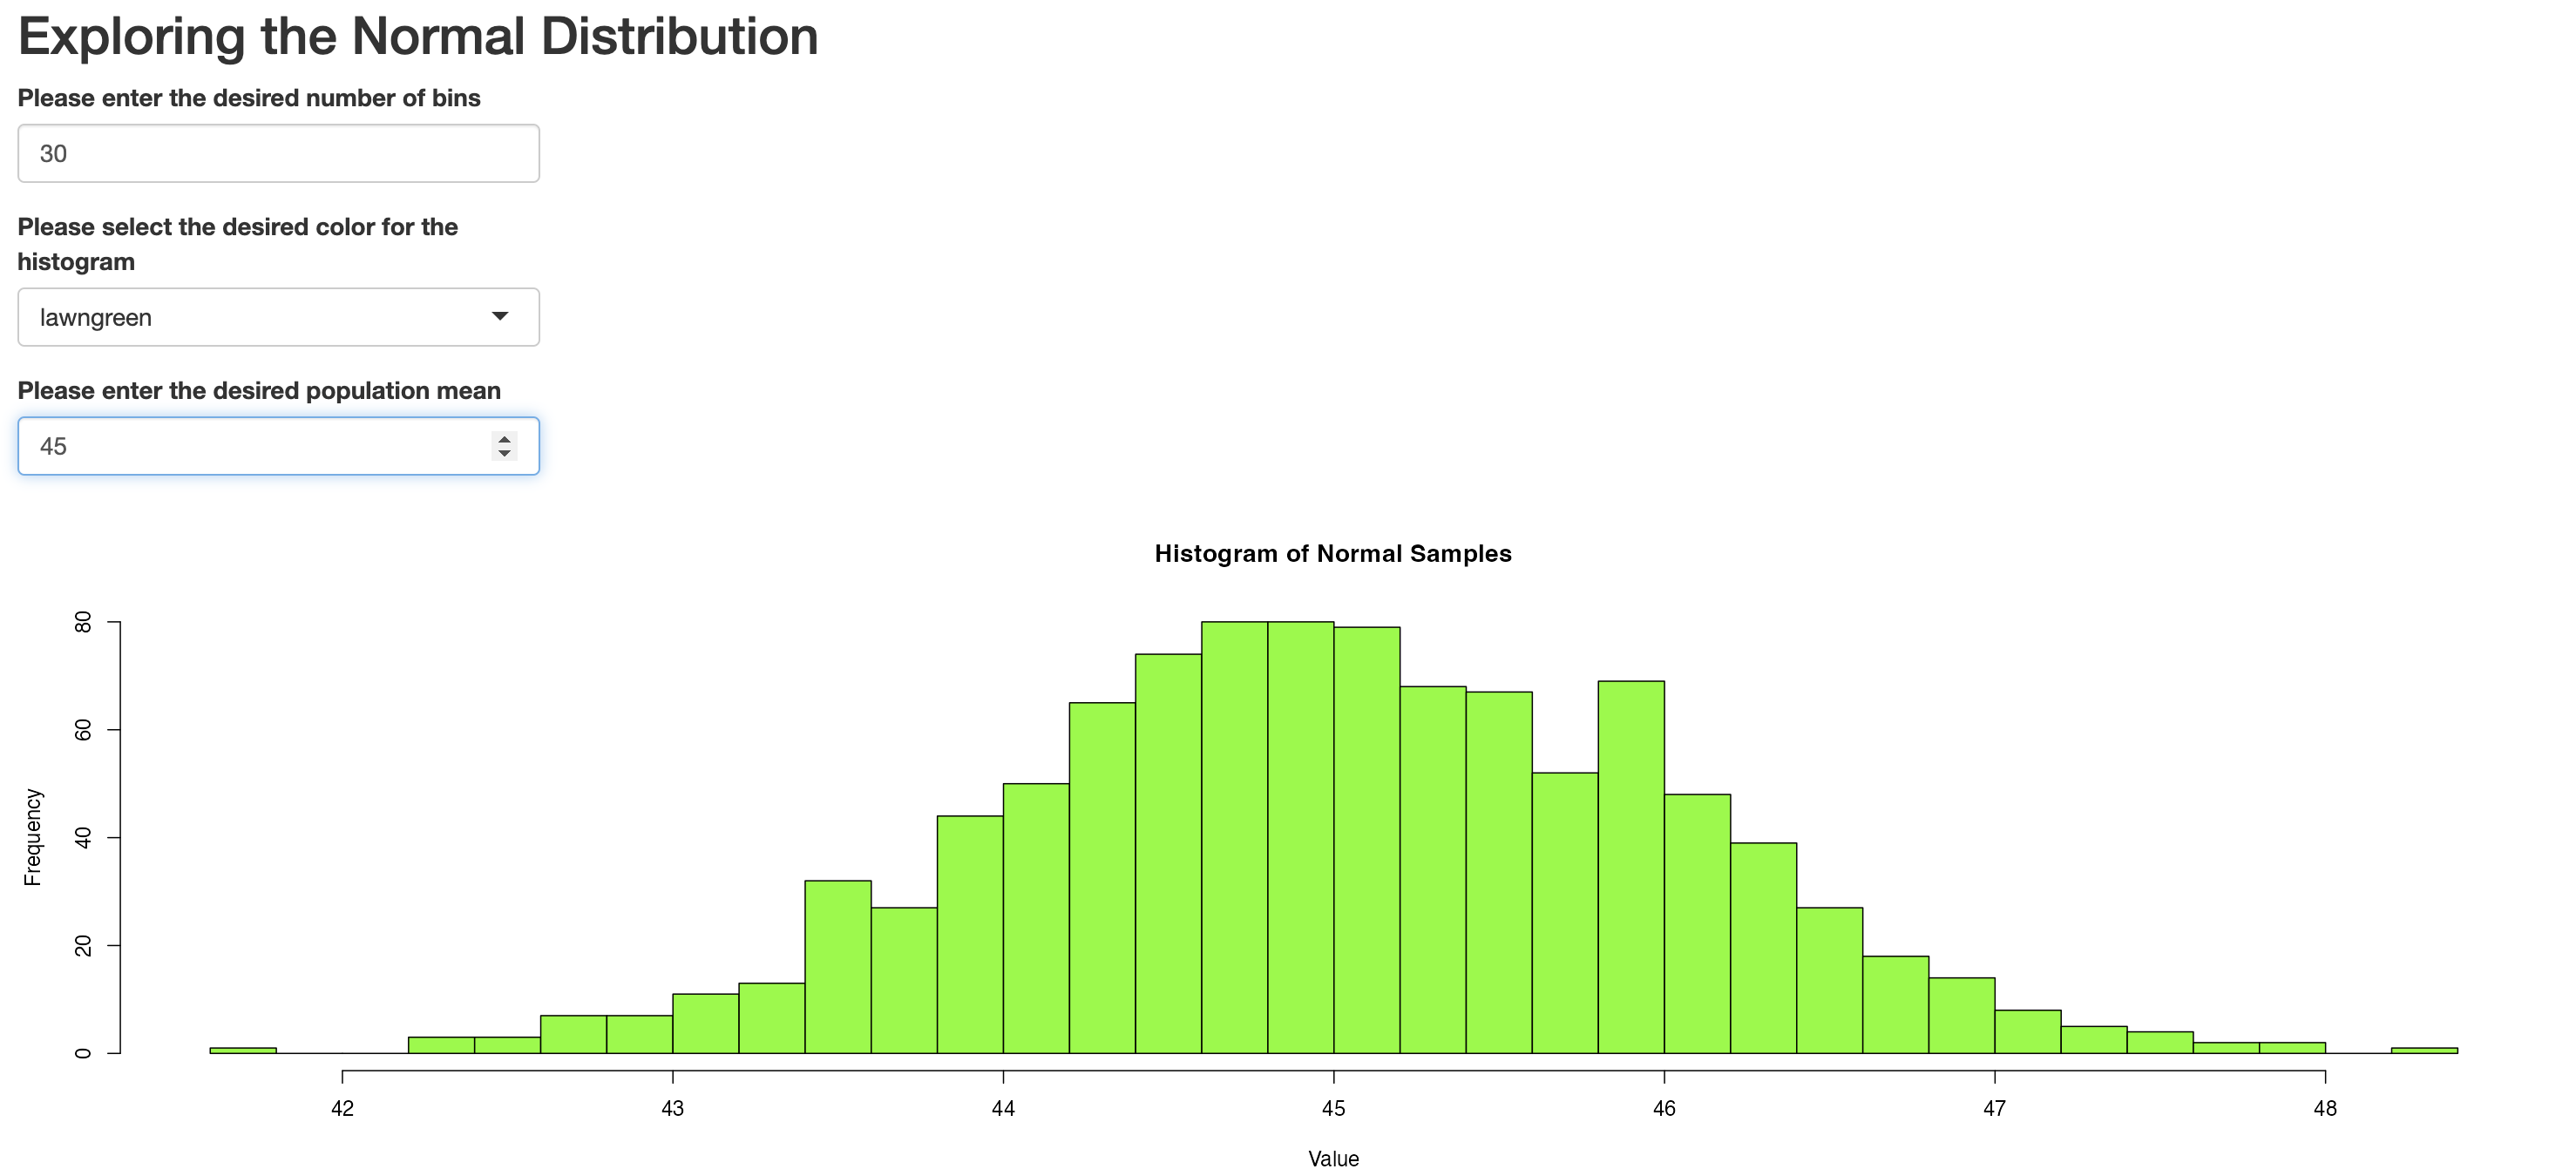 Figure 21. Interactive plot with user inputs for color, number of bins,
and mean
Figure 21. Interactive plot with user inputs for color, number of bins,
and mean
Image 1 of 1: ‘Figure 23. Sidebar layout’
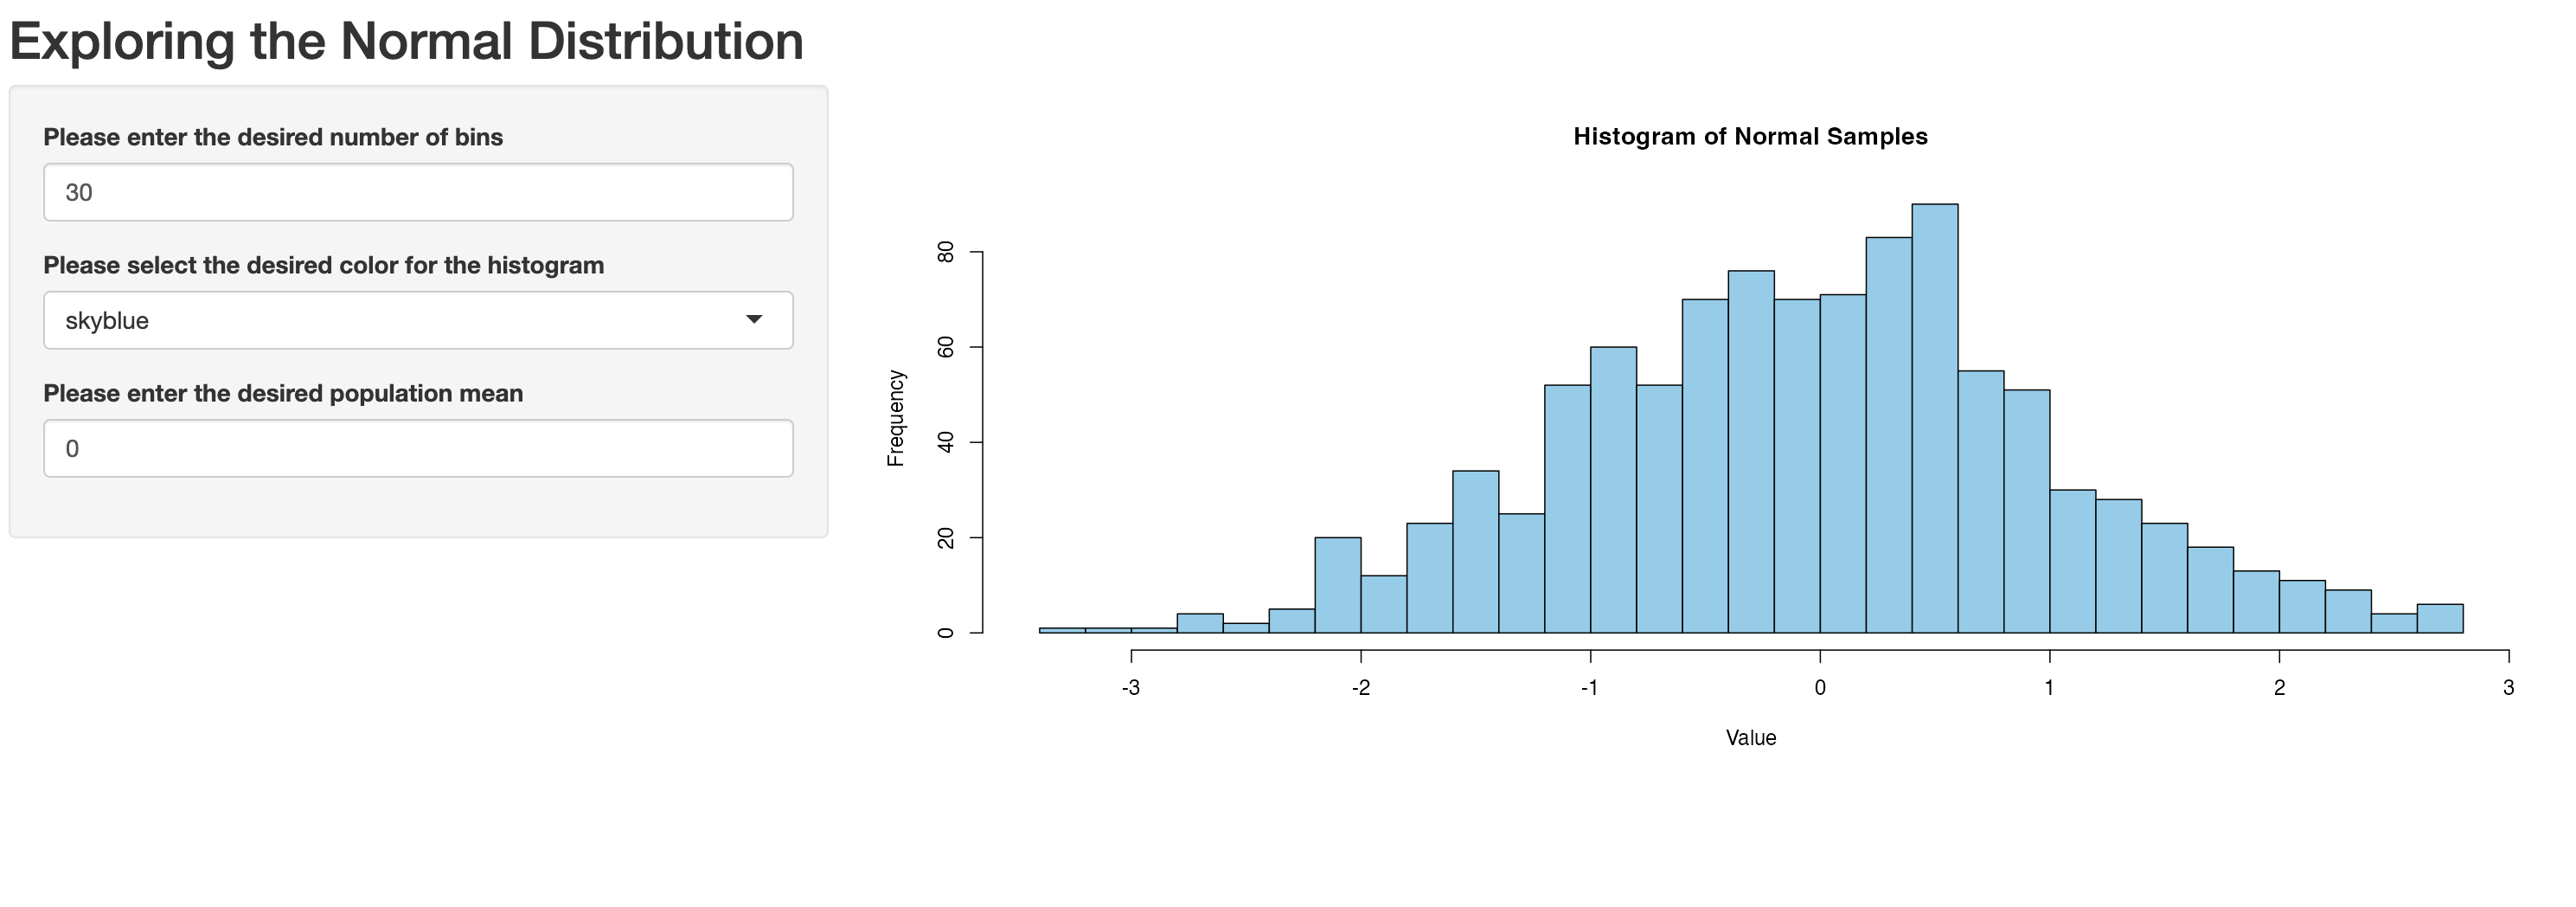 Figure 23. Sidebar layout
Image 1 of 1: ‘Figure 24. Sidebar layout with inputs on the right’
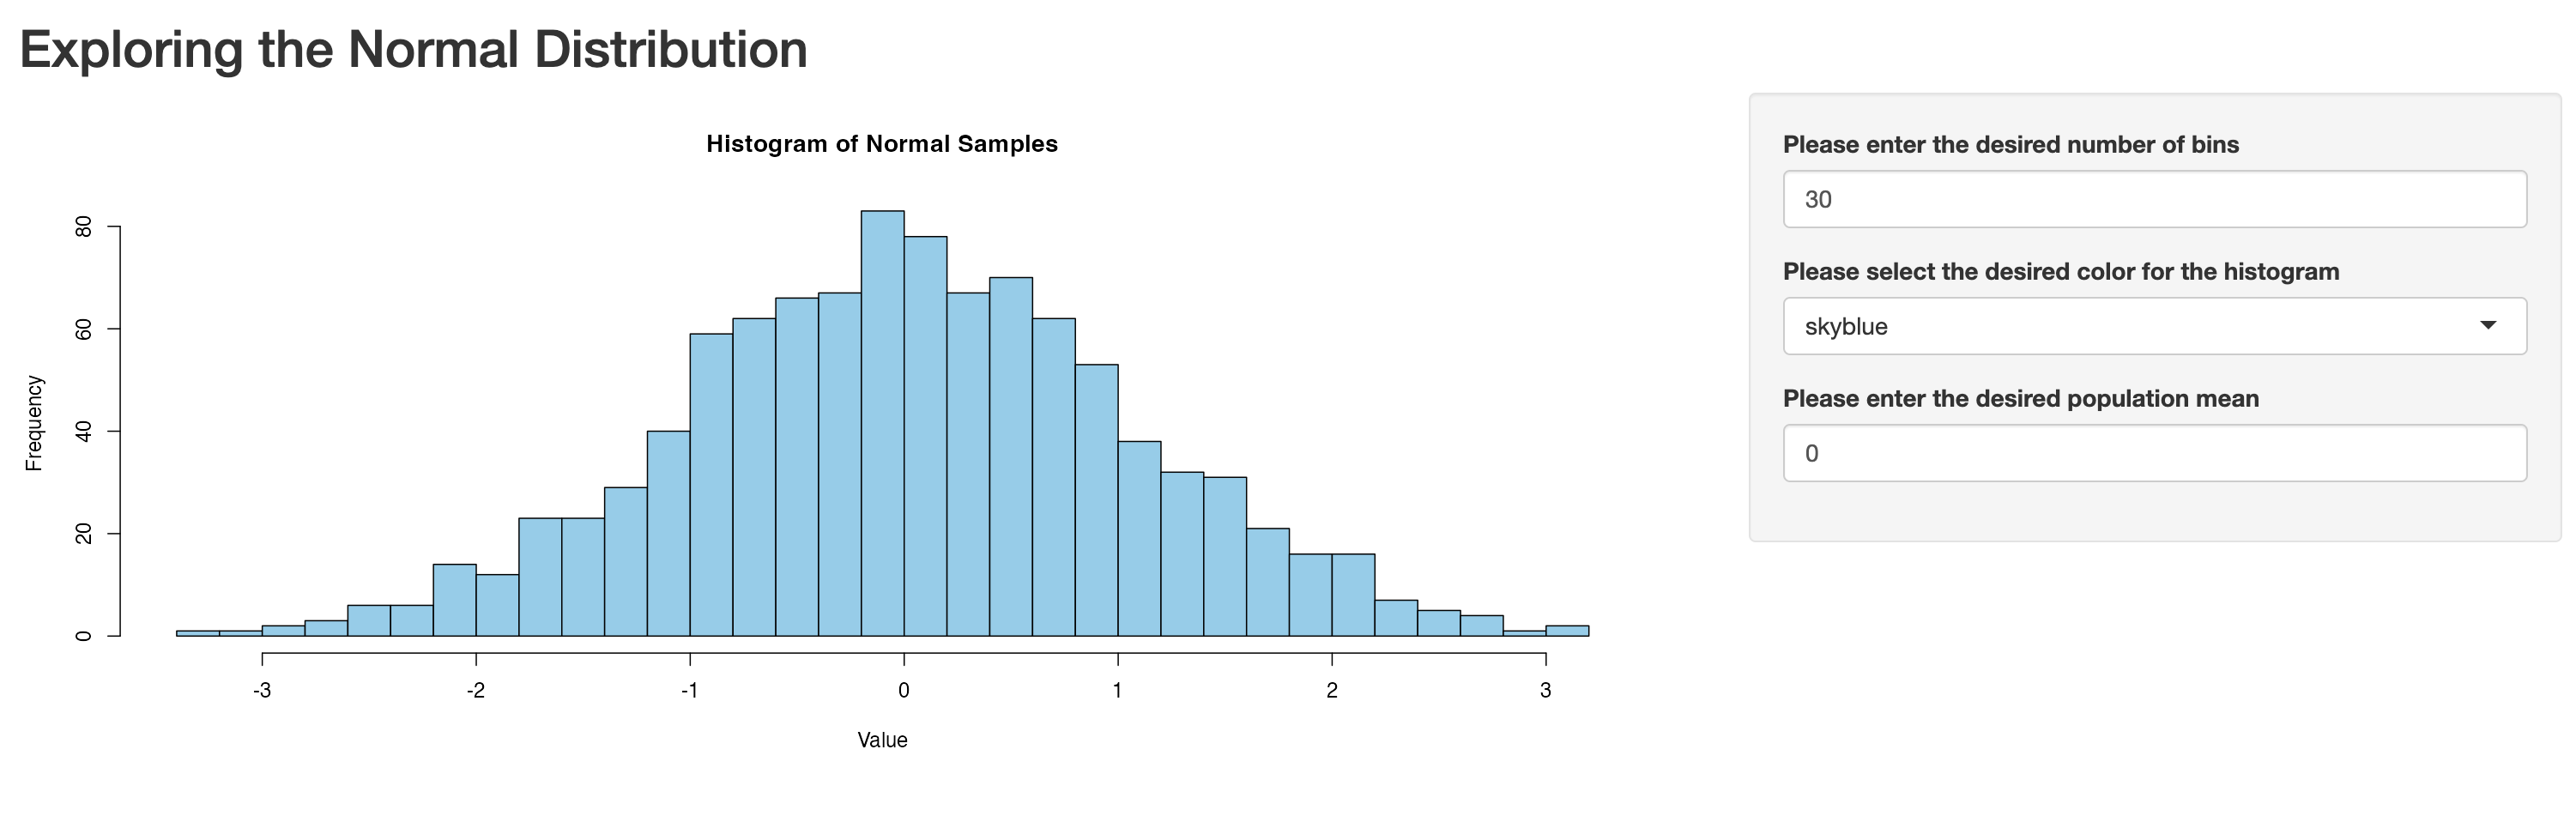 Figure 24. Sidebar layout with inputs on the right
Image 1 of 1: ‘Figure 25. Inputs on the bottom’
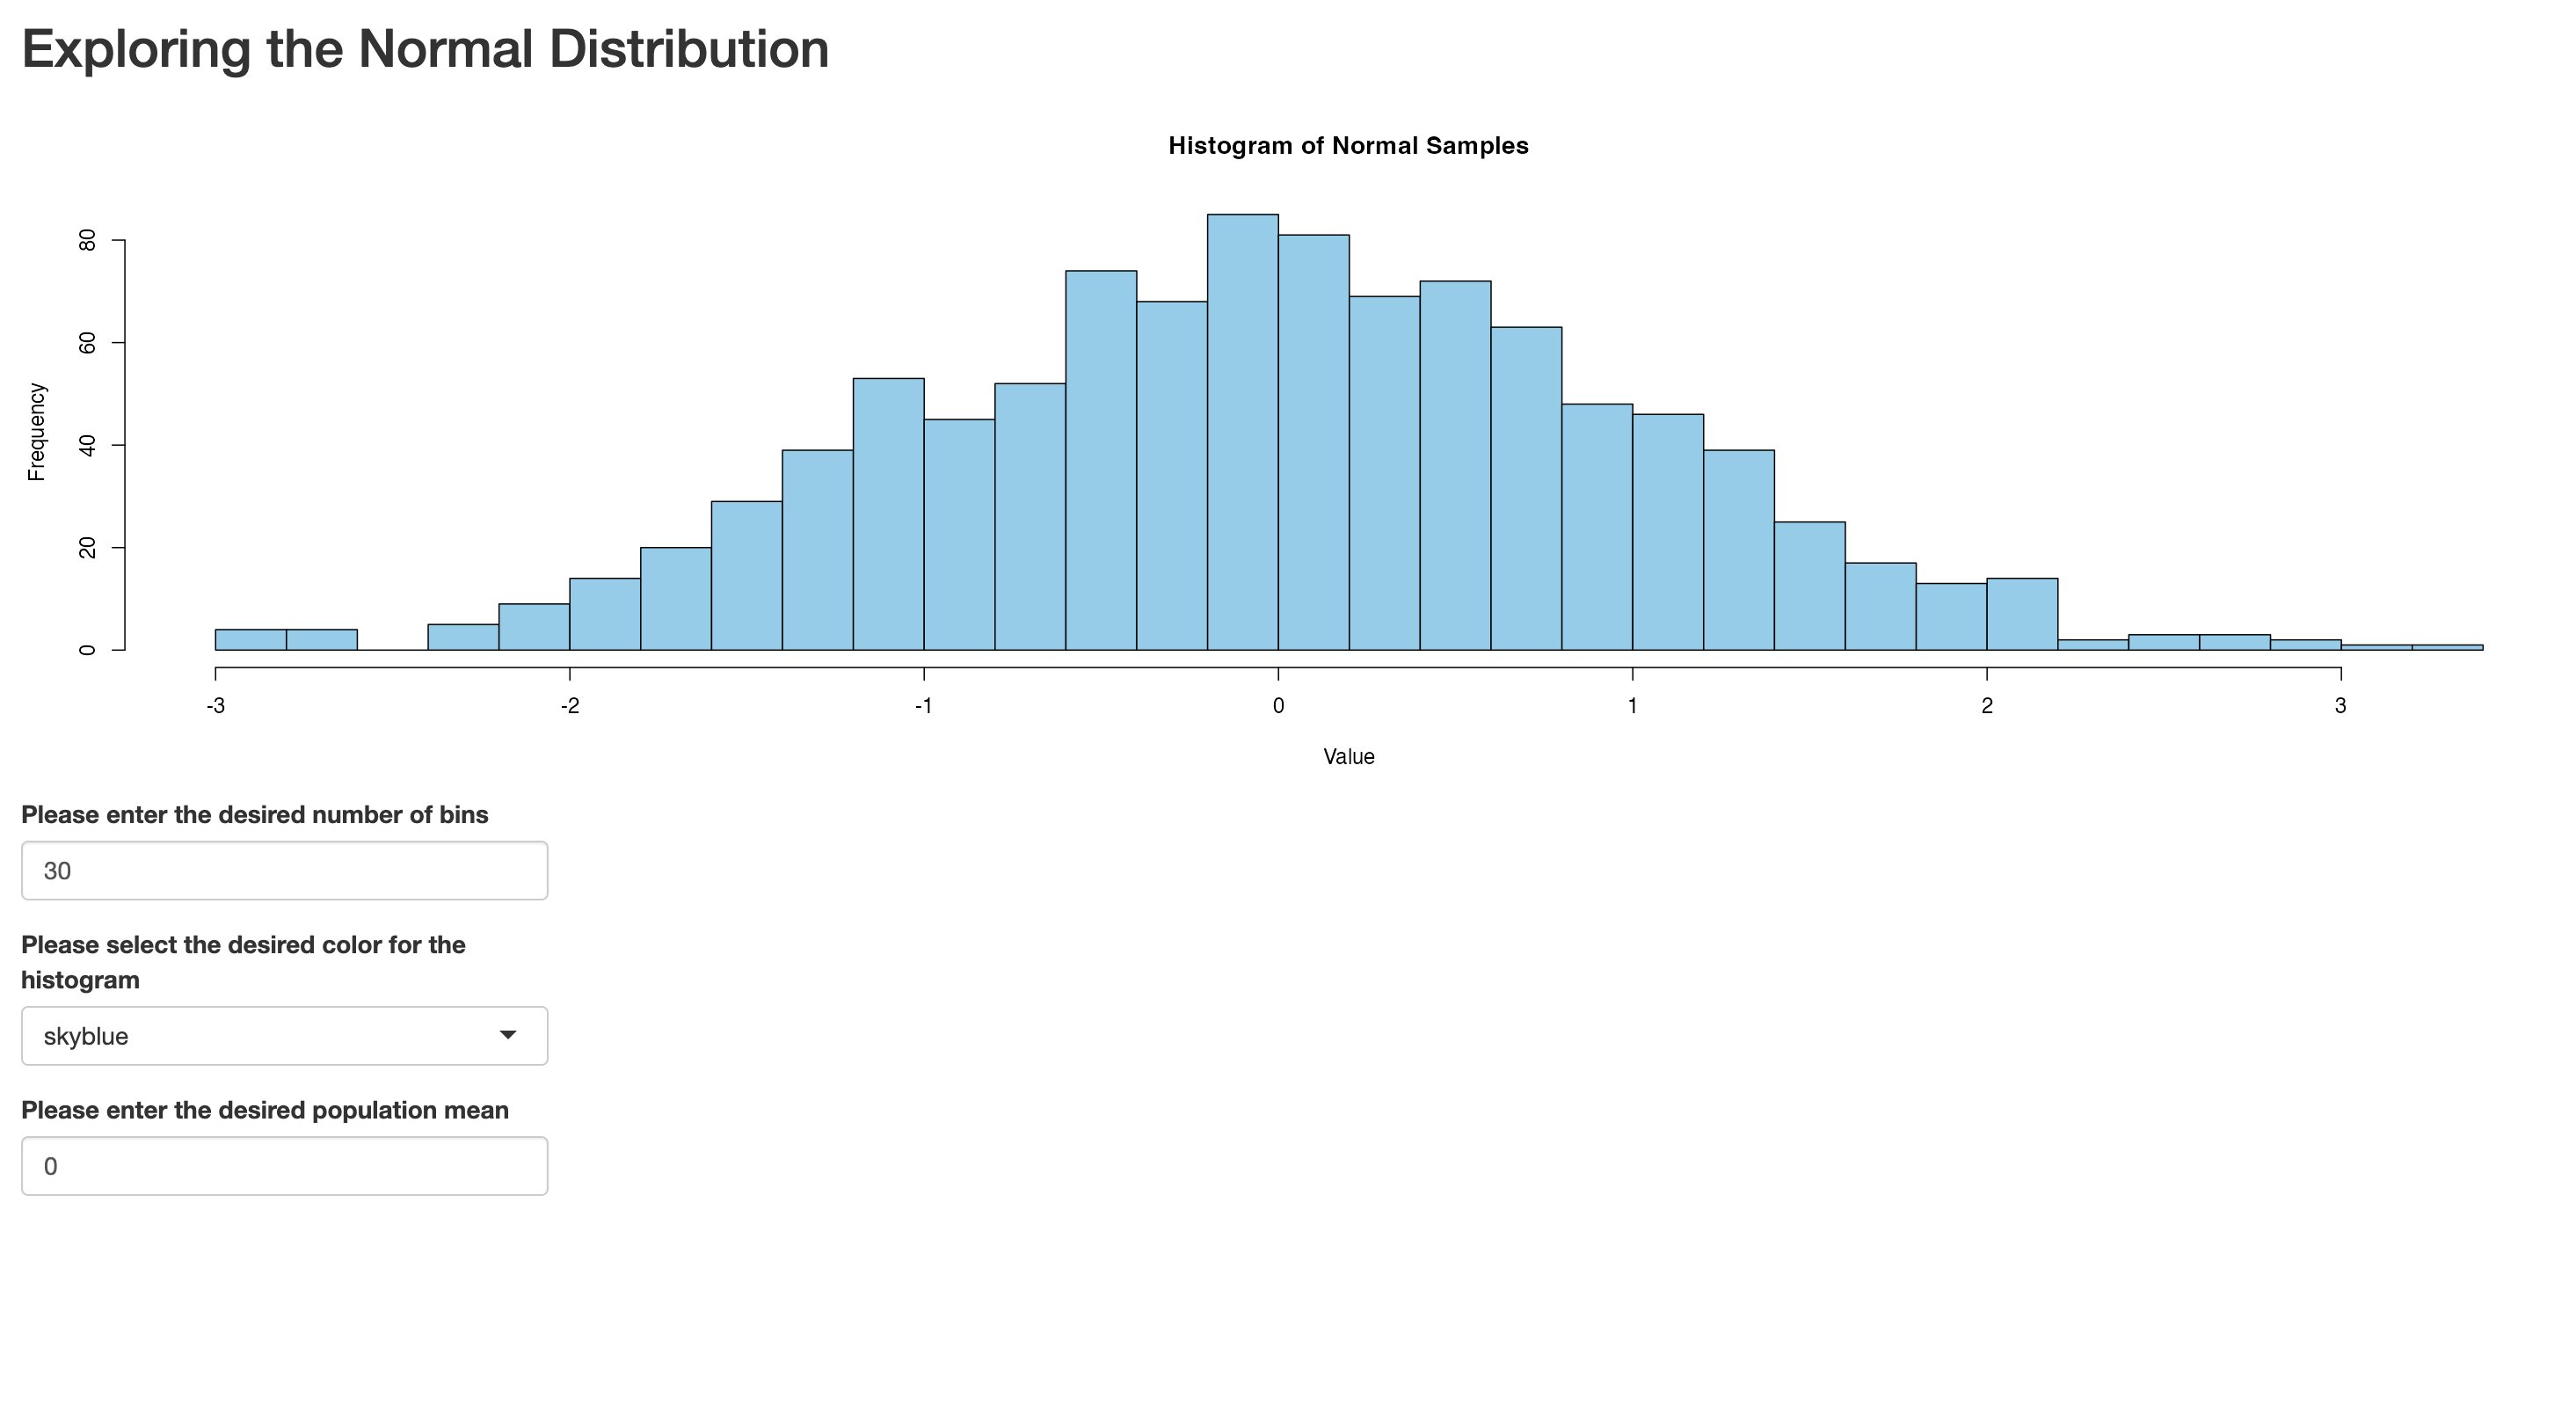 Figure 25. Inputs on the bottom
Image 1 of 1: ‘Figure 26. Tab based app with Histogram tab open’
 Figure 26. Tab based app with Histogram tab open
Image 1 of 1: ‘Figure 27. Tab based app with Explanation tab open’
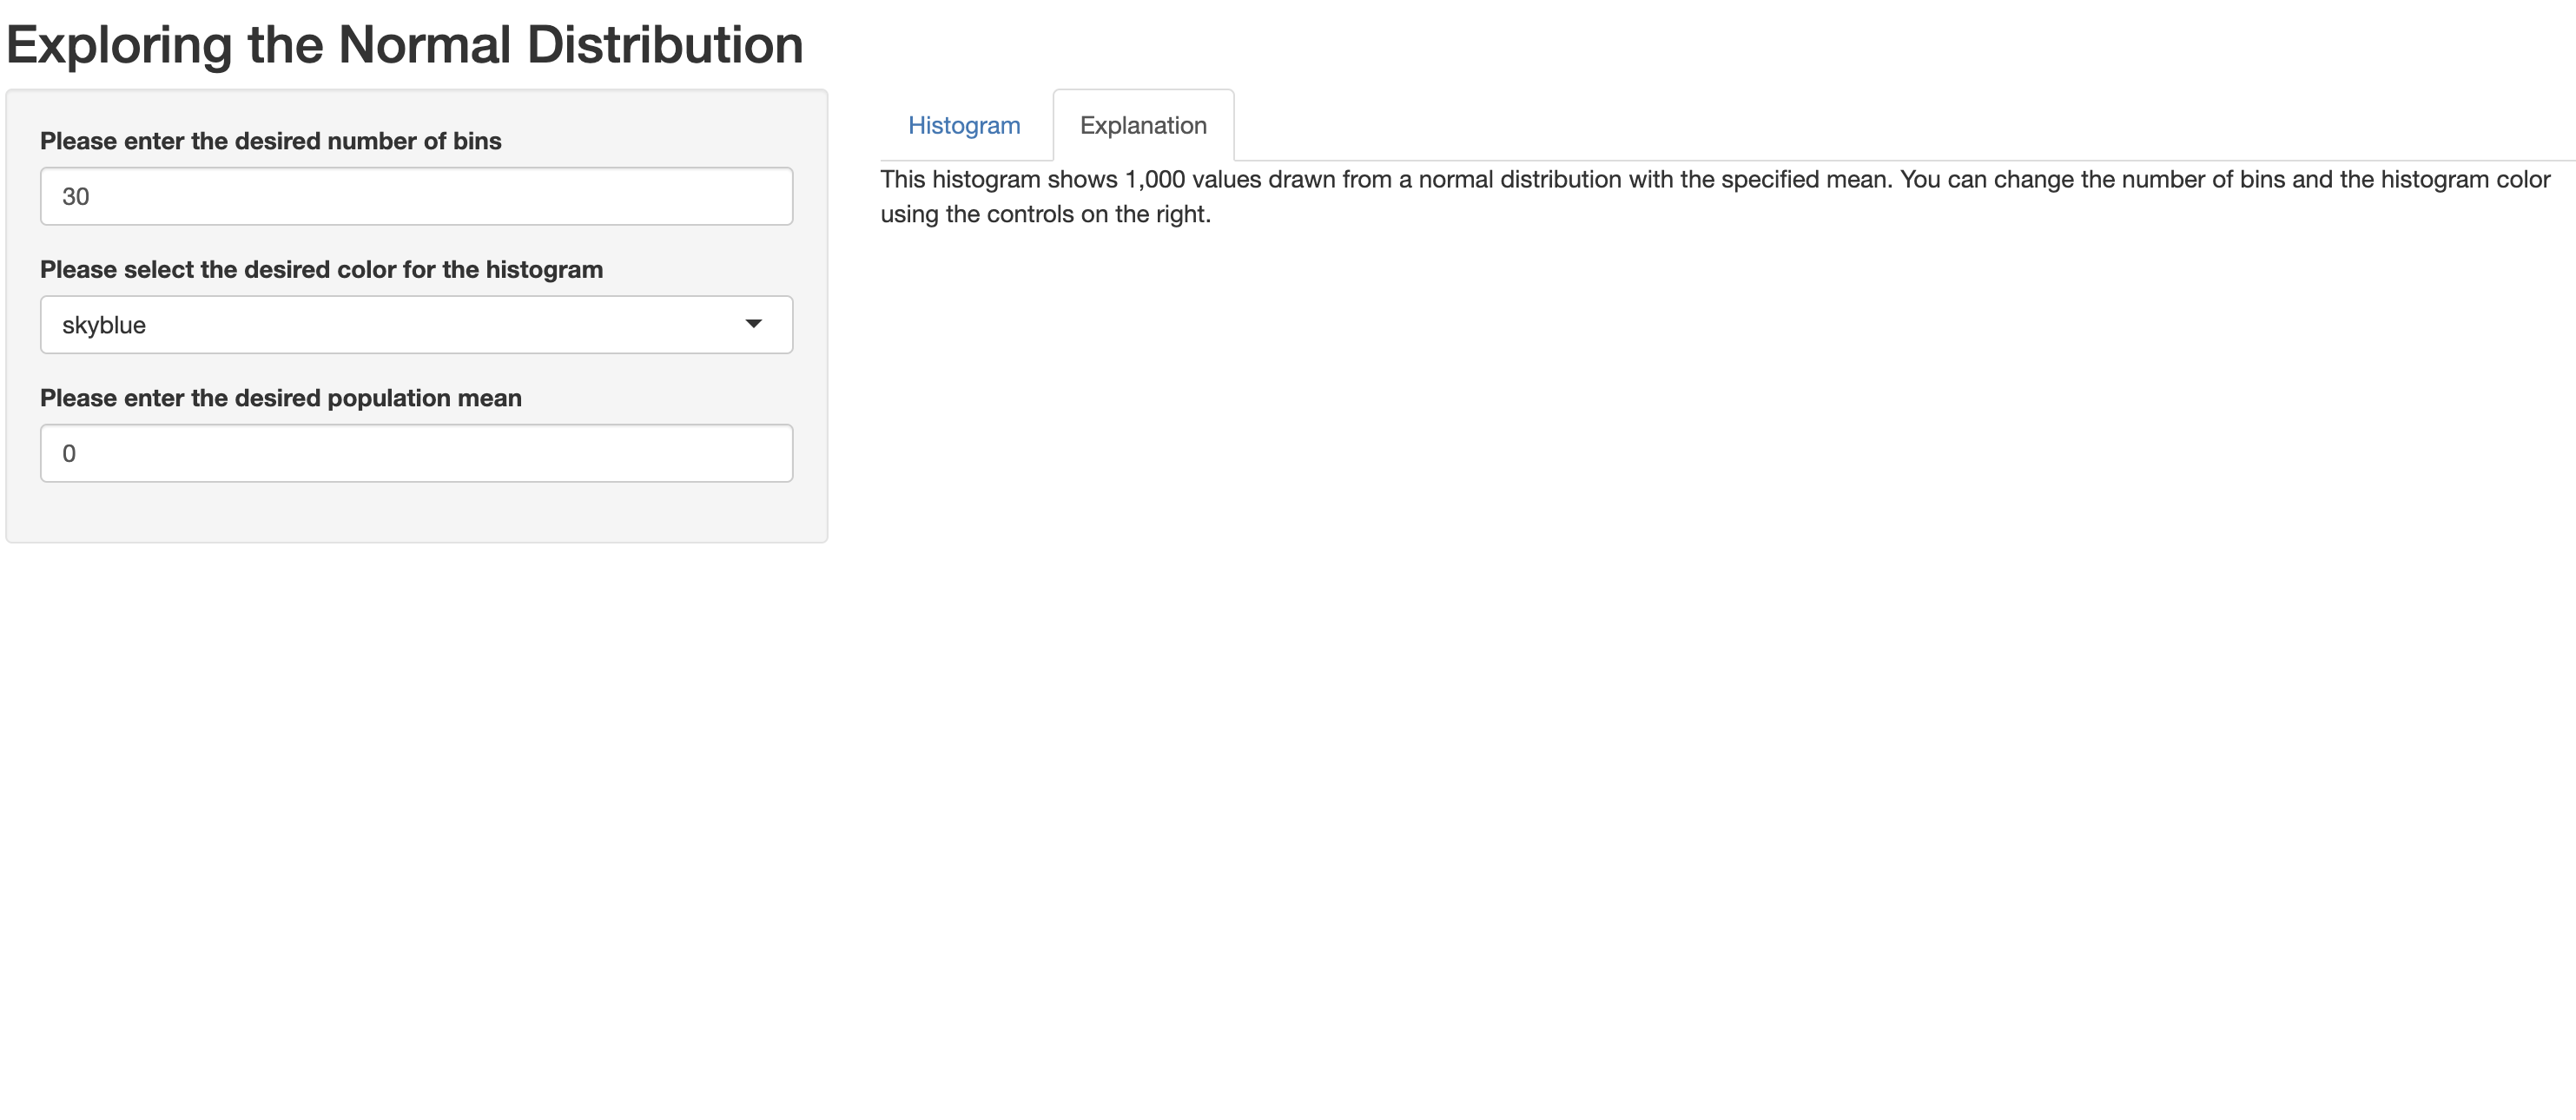 Figure 27. Tab based app with Explanation tab open
Image 1 of 1: ‘Figure 28. Shiny theme selector’
 Figure 28. Shiny theme selector
Image 1 of 1: ‘Figure 29. Shiny superhero theme’
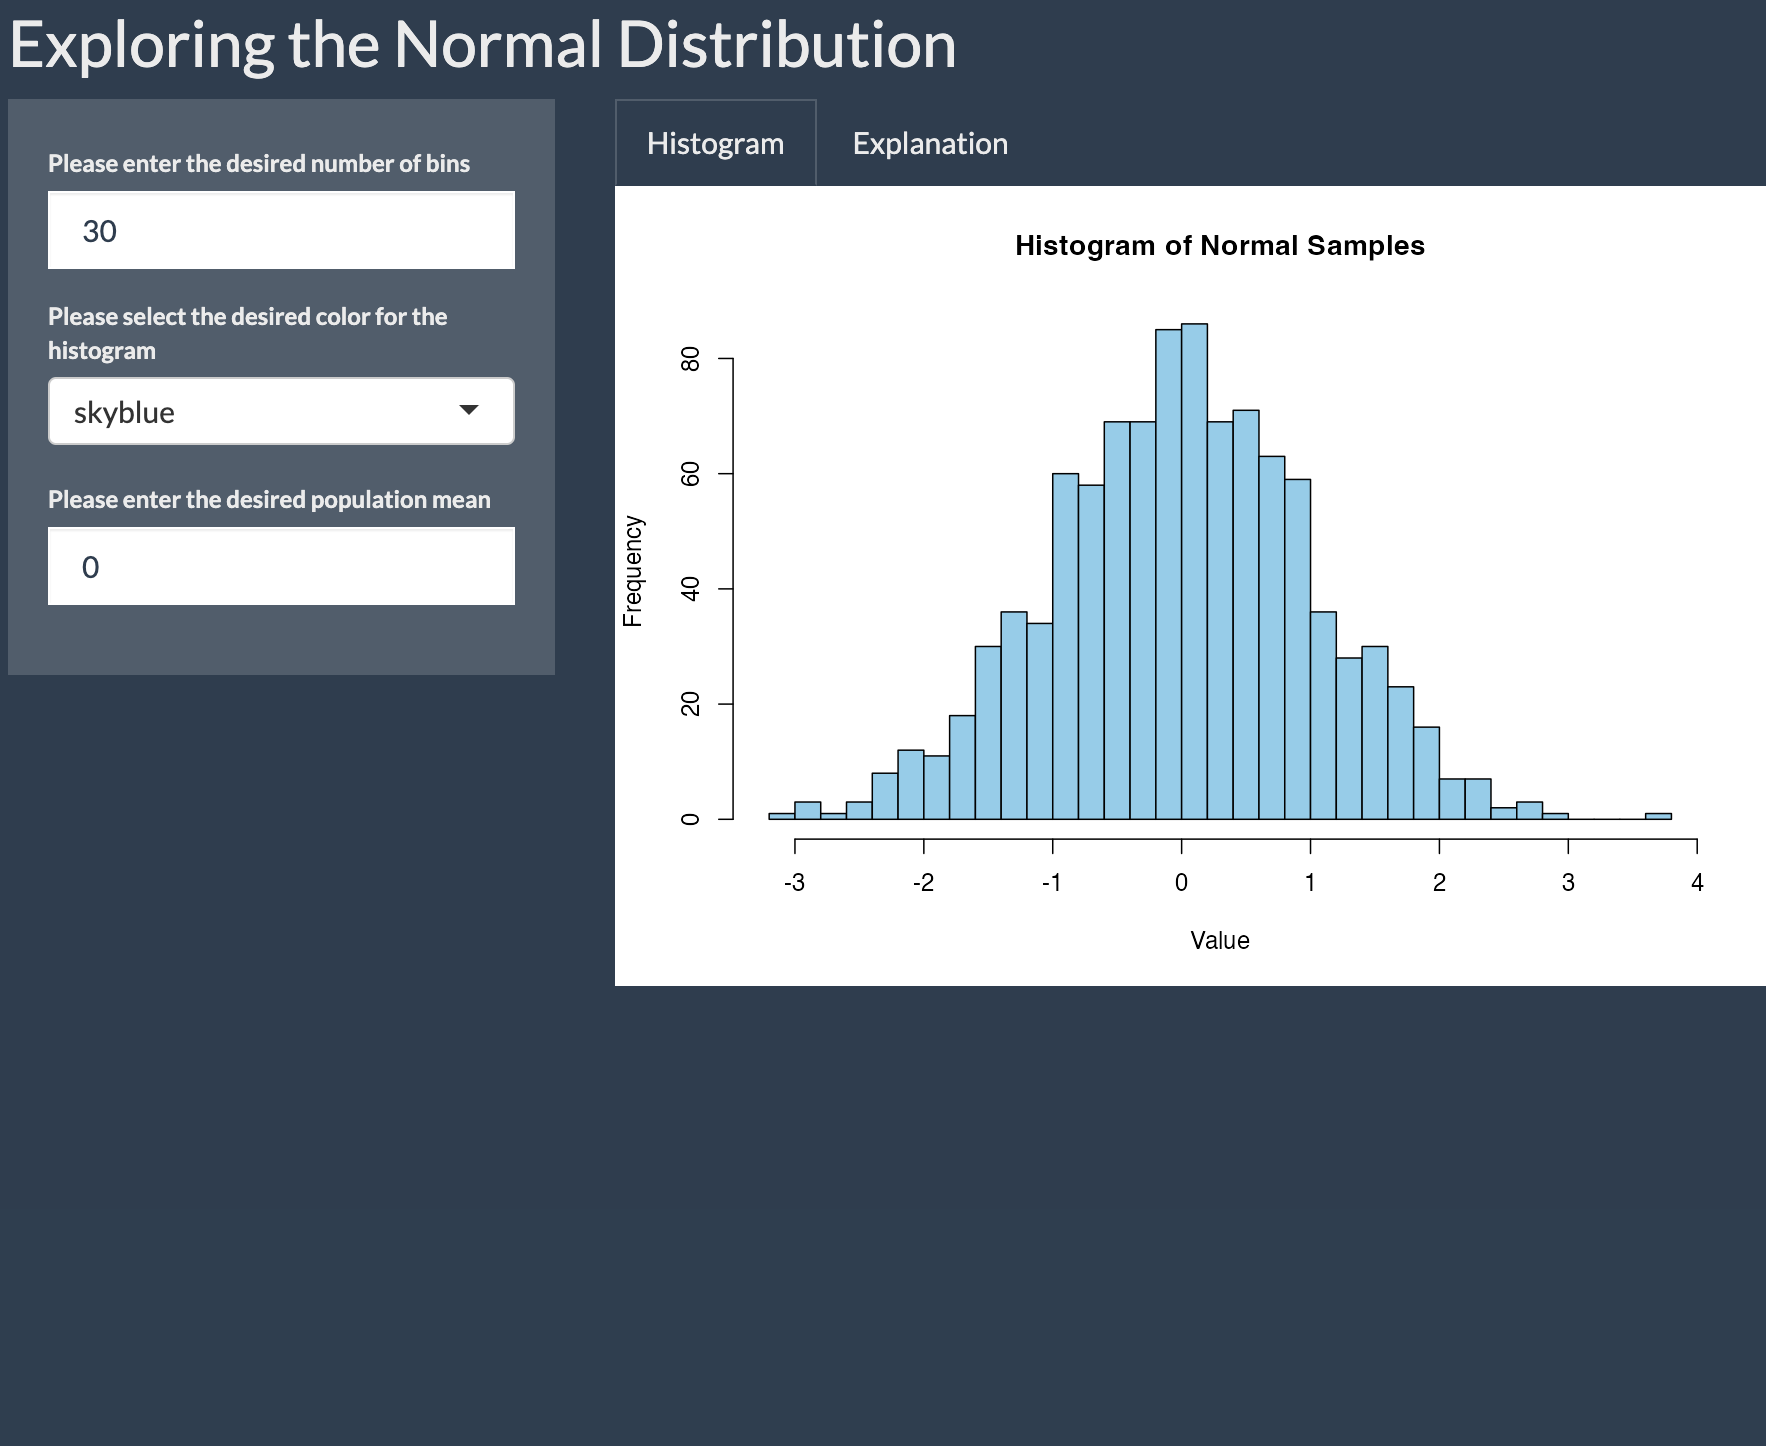 Figure 29. Shiny superhero theme
Image 1 of 1: ‘Figure 30. Tip calculator’
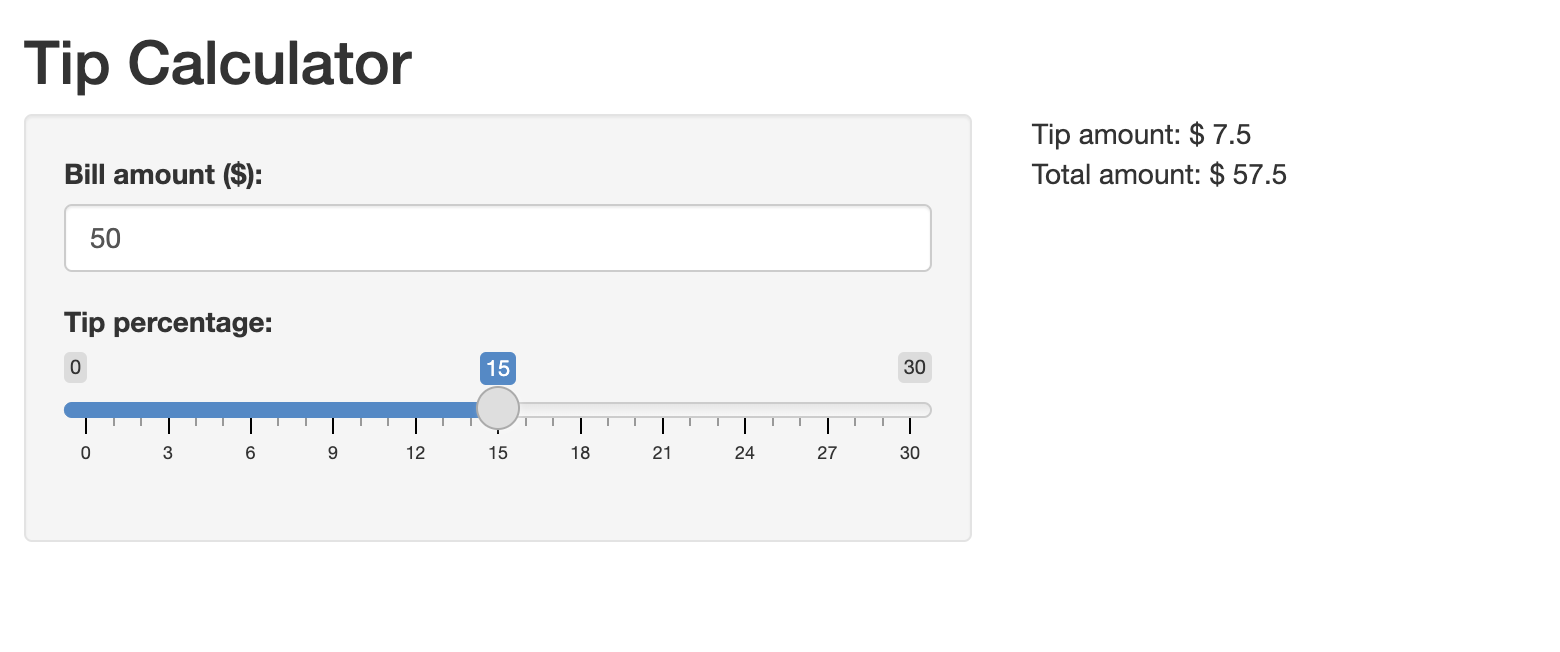 Figure 30. Tip calculator
Image 1 of 1: ‘Figure 31. Tip calculator with activation button’
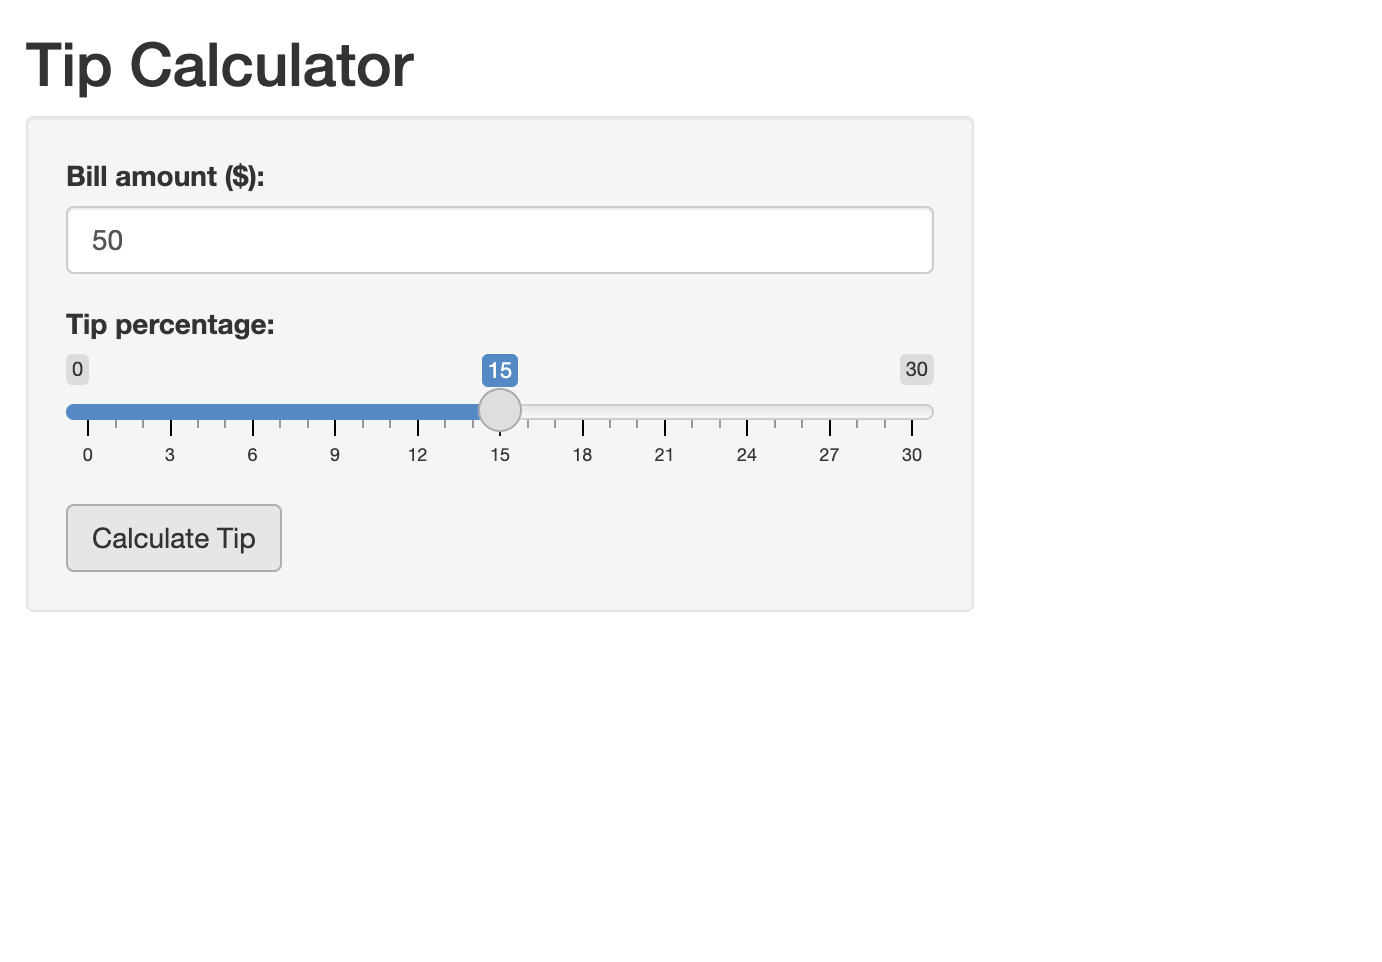 Figure 31. Tip calculator with activation button
Image 1 of 1: ‘Figure 32. The Fahrenheit to Celsius Converter App with Activation Button’
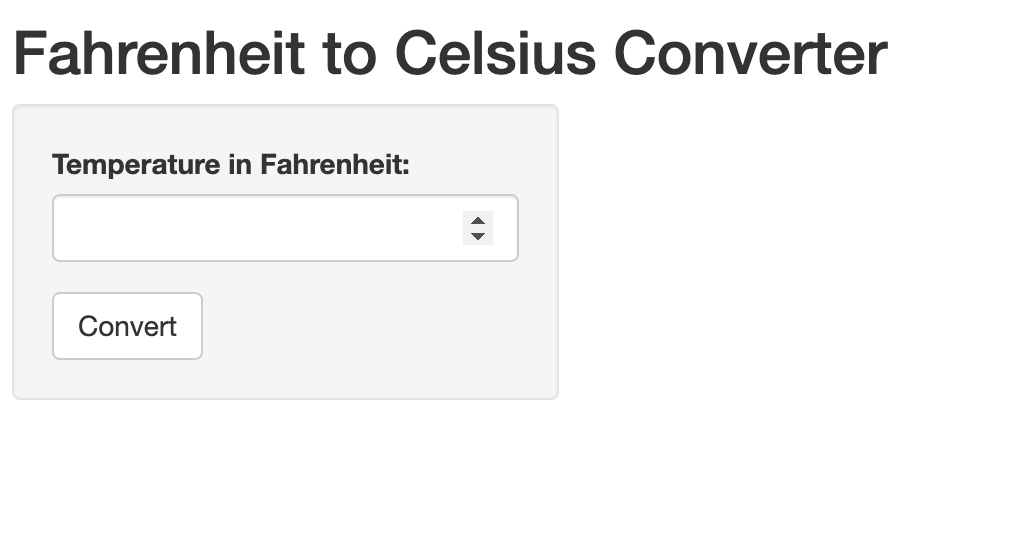 Figure 32. The Fahrenheit to Celsius Converter App with Activation
Button
Figure 32. The Fahrenheit to Celsius Converter App with Activation
Button