The decennial Census with tidycensus
Last updated on 2025-11-11 | Edit this page
Overview
Questions
- How do you import decennial Census data into R Studio using tidycensus?
- How do you process, query, wrangle, and visualize decennial Census data once it is imported into R Studio?
Objectives
- Explain how to use tidycensus to import decennial Census data at various geographic scales, and various temporal periods, into your R Studio environment.
- Process and query decennial Census data to explore simple questions, using the dplyr package
- Visualize decennial Census data using the ggplot2 and *tmap packages
- Export decennial Census datasets and visualizations from your R Studio environment to a local directory in various file formats.
Introduction
R
library(tidycensus)
library(tmap)
library(tidyverse)
Retrieving decennial Census data
R
# loads variable table for 2010 decennial census and assigns it to object named
# "decennial_variables_2010"
 decennial_variables_2010<-load_variables(2010, "sf1")
R
# prints "decennial_variables_2010"
decennial_variables_2010
OUTPUT
# A tibble: 8,959 × 3
   name    label                                concept
   <chr>   <chr>                                <chr>
 1 H001001 Total                                HOUSING UNITS
 2 H002001 Total                                URBAN AND RURAL
 3 H002002 Total!!Urban                         URBAN AND RURAL
 4 H002003 Total!!Urban!!Inside urbanized areas URBAN AND RURAL
 5 H002004 Total!!Urban!!Inside urban clusters  URBAN AND RURAL
 6 H002005 Total!!Rural                         URBAN AND RURAL
 7 H002006 Total!!Not defined for this file     URBAN AND RURAL
 8 H003001 Total                                OCCUPANCY STATUS
 9 H003002 Total!!Occupied                      OCCUPANCY STATUS
10 H003003 Total!!Vacant                        OCCUPANCY STATUS
# ℹ 8,949 more rows
R
# brings up "decennial_variables_2010" in data Viewer
View(decennial_variables_2010)
| name | label | concept |
|---|---|---|
| H001001 | Total | HOUSING UNITS |
| H002001 | Total | URBAN AND RURAL |
| H002002 | Total!!Urban | URBAN AND RURAL |
| H002003 | Total!!Urban!!Inside urbanized areas | URBAN AND RURAL |
| H002004 | Total!!Urban!!Inside urban clusters | URBAN AND RURAL |
| H002005 | Total!!Rural | URBAN AND RURAL |
| H002006 | Total!!Not defined for this file | URBAN AND RURAL |
| H003001 | Total | OCCUPANCY STATUS |
| H003002 | Total!!Occupied | OCCUPANCY STATUS |
| H003003 | Total!!Vacant | OCCUPANCY STATUS |
| H004001 | Total | TENURE |
| H004002 | Total!!Owned with a mortgage or a loan | TENURE |
| H004003 | Total!!Owned free and clear | TENURE |
| H004004 | Total!!Renter occupied | TENURE |
| H005001 | Total | VACANCY STATUS |
| H005002 | Total!!For rent | VACANCY STATUS |
| H005003 | Total!!Rented, not occupied | VACANCY STATUS |
| H005004 | Total!!For sale only | VACANCY STATUS |
| H005005 | Total!!Sold, not occupied | VACANCY STATUS |
| H005006 | Total!!For seasonal, recreational, or occasional use | VACANCY STATUS |
| H005007 | Total!!For migrant workers | VACANCY STATUS |
| H005008 | Total!!Other vacant | VACANCY STATUS |
| H006001 | Total | RACE OF HOUSEHOLDER |
| H006002 | Total!!Householder who is White alone | RACE OF HOUSEHOLDER |
| H006003 | Total!!Householder who is Black or African American alone | RACE OF HOUSEHOLDER |
| H006004 | Total!!Householder who is American Indian and Alaska Native alone | RACE OF HOUSEHOLDER |
| H006005 | Total!!Householder who is Asian alone | RACE OF HOUSEHOLDER |
| H006006 | Total!!Householder who is Native Hawaiian and Other Pacific Islander alone | RACE OF HOUSEHOLDER |
| H006007 | Total!!Householder who is Some Other Race alone | RACE OF HOUSEHOLDER |
| H006008 | Total!!Householder who is Two or More Races | RACE OF HOUSEHOLDER |
| H007001 | Total | HISPANIC OR LATINO ORIGIN OF HOUSEHOLDER BY RACE OF HOUSEHOLDER |
| H007002 | Total!!Not Hispanic or Latino householder | HISPANIC OR LATINO ORIGIN OF HOUSEHOLDER BY RACE OF HOUSEHOLDER |
| H007003 | Total!!Not Hispanic or Latino householder!!Householder who is White alone | HISPANIC OR LATINO ORIGIN OF HOUSEHOLDER BY RACE OF HOUSEHOLDER |
| H007004 | Total!!Not Hispanic or Latino householder!!Householder who is Black or African American alone | HISPANIC OR LATINO ORIGIN OF HOUSEHOLDER BY RACE OF HOUSEHOLDER |
| H007005 | Total!!Not Hispanic or Latino householder!!Householder who is American Indian and Alaska Native alone | HISPANIC OR LATINO ORIGIN OF HOUSEHOLDER BY RACE OF HOUSEHOLDER |
| H007006 | Total!!Not Hispanic or Latino householder!!Householder who is Asian alone | HISPANIC OR LATINO ORIGIN OF HOUSEHOLDER BY RACE OF HOUSEHOLDER |
| H007007 | Total!!Not Hispanic or Latino householder!!Householder who is Native Hawaiian and Other Pacific Islander alone | HISPANIC OR LATINO ORIGIN OF HOUSEHOLDER BY RACE OF HOUSEHOLDER |
| H007008 | Total!!Not Hispanic or Latino householder!!Householder who is Some Other Race alone | HISPANIC OR LATINO ORIGIN OF HOUSEHOLDER BY RACE OF HOUSEHOLDER |
| H007009 | Total!!Not Hispanic or Latino householder!!Householder who is Two or More Races | HISPANIC OR LATINO ORIGIN OF HOUSEHOLDER BY RACE OF HOUSEHOLDER |
| H007010 | Total!!Hispanic or Latino householder | HISPANIC OR LATINO ORIGIN OF HOUSEHOLDER BY RACE OF HOUSEHOLDER |
test
Cleaning and processing decennial Census datasets
Visualizing decennial Census data with ggplot2
Mapping decennial Census data with tmap
Working with multiple Census datasets
Exporting decennial Census datasets and analysis products from R Studio
This is a lesson created via The Carpentries Workbench. It is written
in Pandoc-flavored Markdown
for static files (with extension .md) and R Markdown for dynamic files
that can render code into output (with extension .Rmd).
Please refer to the Introduction to The
Carpentries Workbench for full documentation.
What you need to know is that there are three sections required for a valid Carpentries lesson template:
-
questionsare displayed at the beginning of the episode to prime the learner for the content. -
objectivesare the learning objectives for an episode displayed with the questions. -
keypointsare displayed at the end of the episode to reinforce the objectives.
Challenge 1: Can you do it?
What is the output of this command?
R
paste("This", "new", "lesson", "looks", "good")
OUTPUT
[1] "This new lesson looks good"Challenge 2: how do you nest solutions within challenge blocks?
You can add a line with at least three colons and a
solution tag.
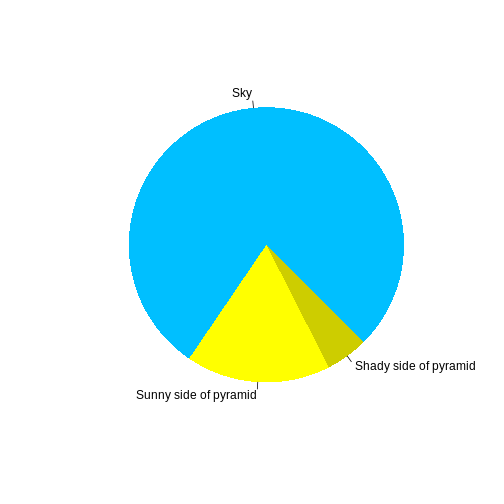
Figures
You can include figures generated from R Markdown:
R
pie(
  c(Sky = 78, "Sunny side of pyramid" = 17, "Shady side of pyramid" = 5),
  init.angle = 315,
  col = c("deepskyblue", "yellow", "yellow3"),
  border = FALSE
)
Or you can use pandoc markdown for static figures with the following syntax:
{alt='alt text for accessibility purposes'}
Math
One of our episodes contains \(\LaTeX\) equations when describing how to create dynamic reports with {knitr}, so we now use mathjax to describe this:
$\alpha = \dfrac{1}{(1 - \beta)^2}$ becomes: \(\alpha = \dfrac{1}{(1 - \beta)^2}\)
Cool, right?
- Use
.mdfiles for episodes when you want static content - Use
.Rmdfiles for episodes when you need to generate output - Run
sandpaper::check_lesson()to identify any issues with your lesson - Run
sandpaper::build_lesson()to preview your lesson locally